
cEEGrids vs scalp O1 Alpha Response -- Live FFT vs PSD Discrepancy

Hi all,
In the OpenBCI hardware setup tutorial, you’re told to check for a pronounced alpha peak on O1 to confirm signal quality.
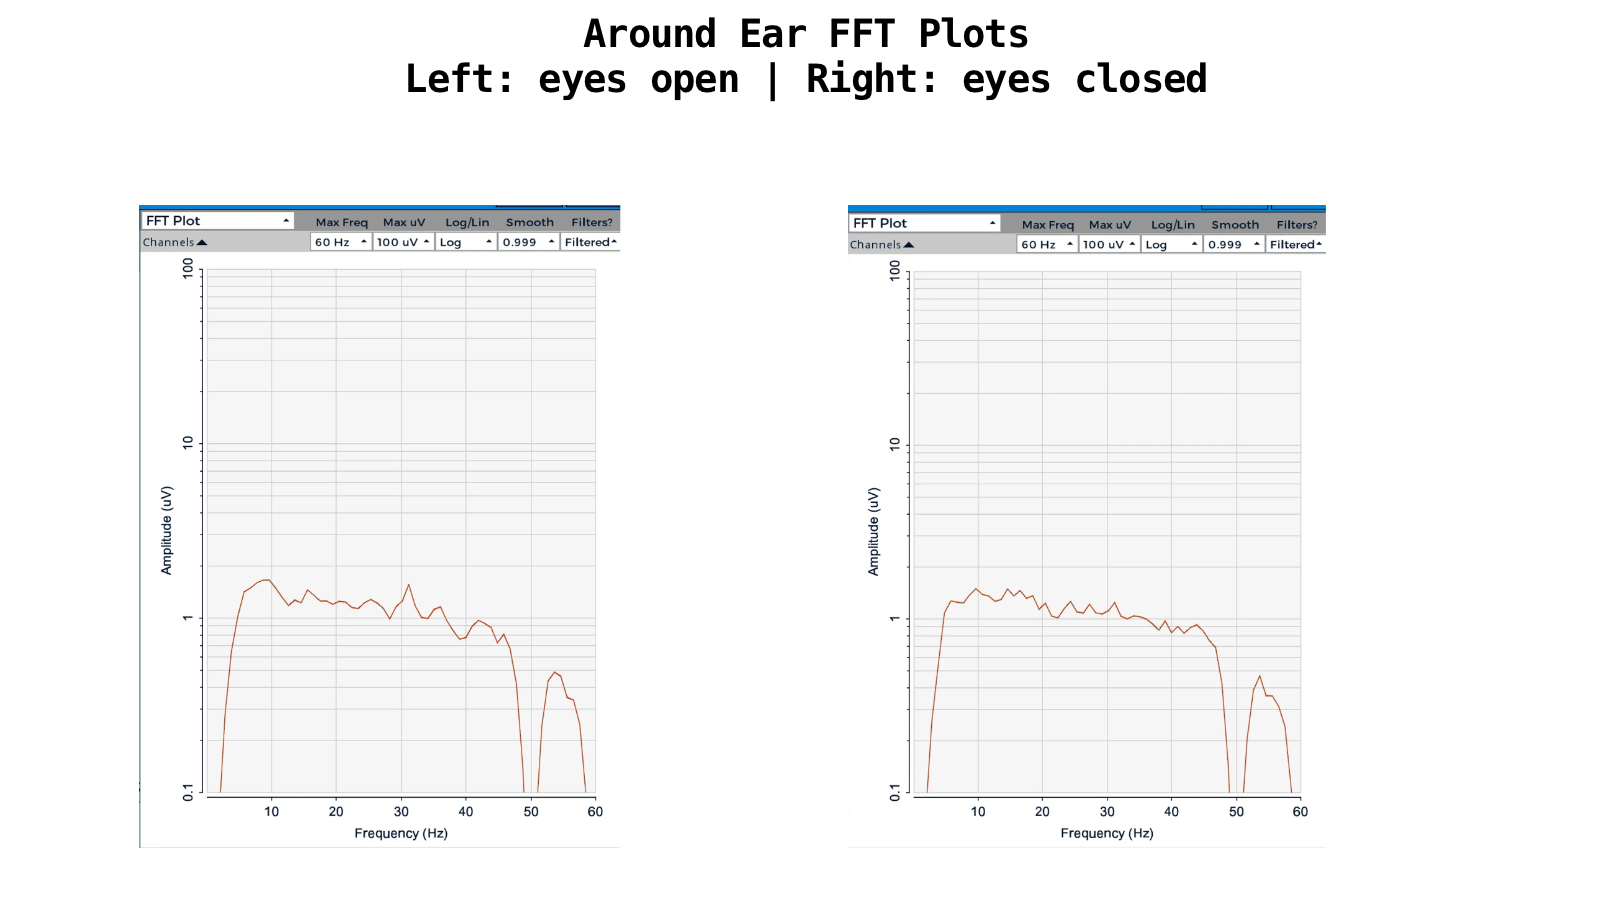
I first tried this with cEEGrids (around-ear electrodes) but didn’t see much of an alpha spike in the live FFT, so I assumed the effect was too weak that far from the occipital lobe.
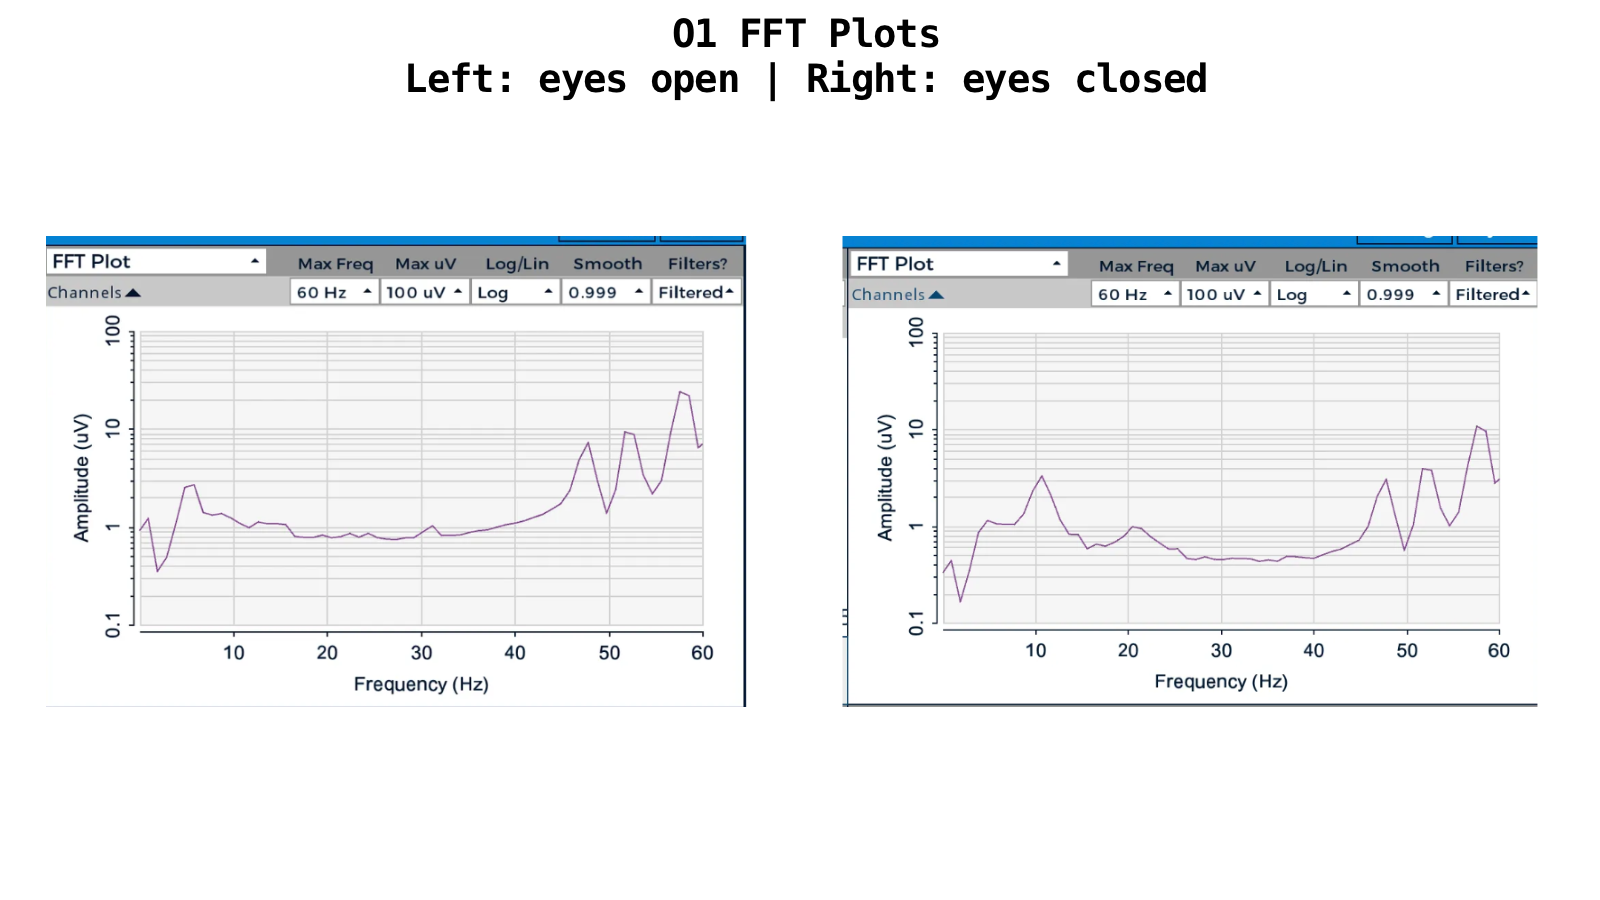
To verify, I switched to a dry polymer comb electrode at O1. On the OpenBCI GUI’s live FFT, I saw a clear alpha peak at ~10 Hz — exactly as expected. So far so good.
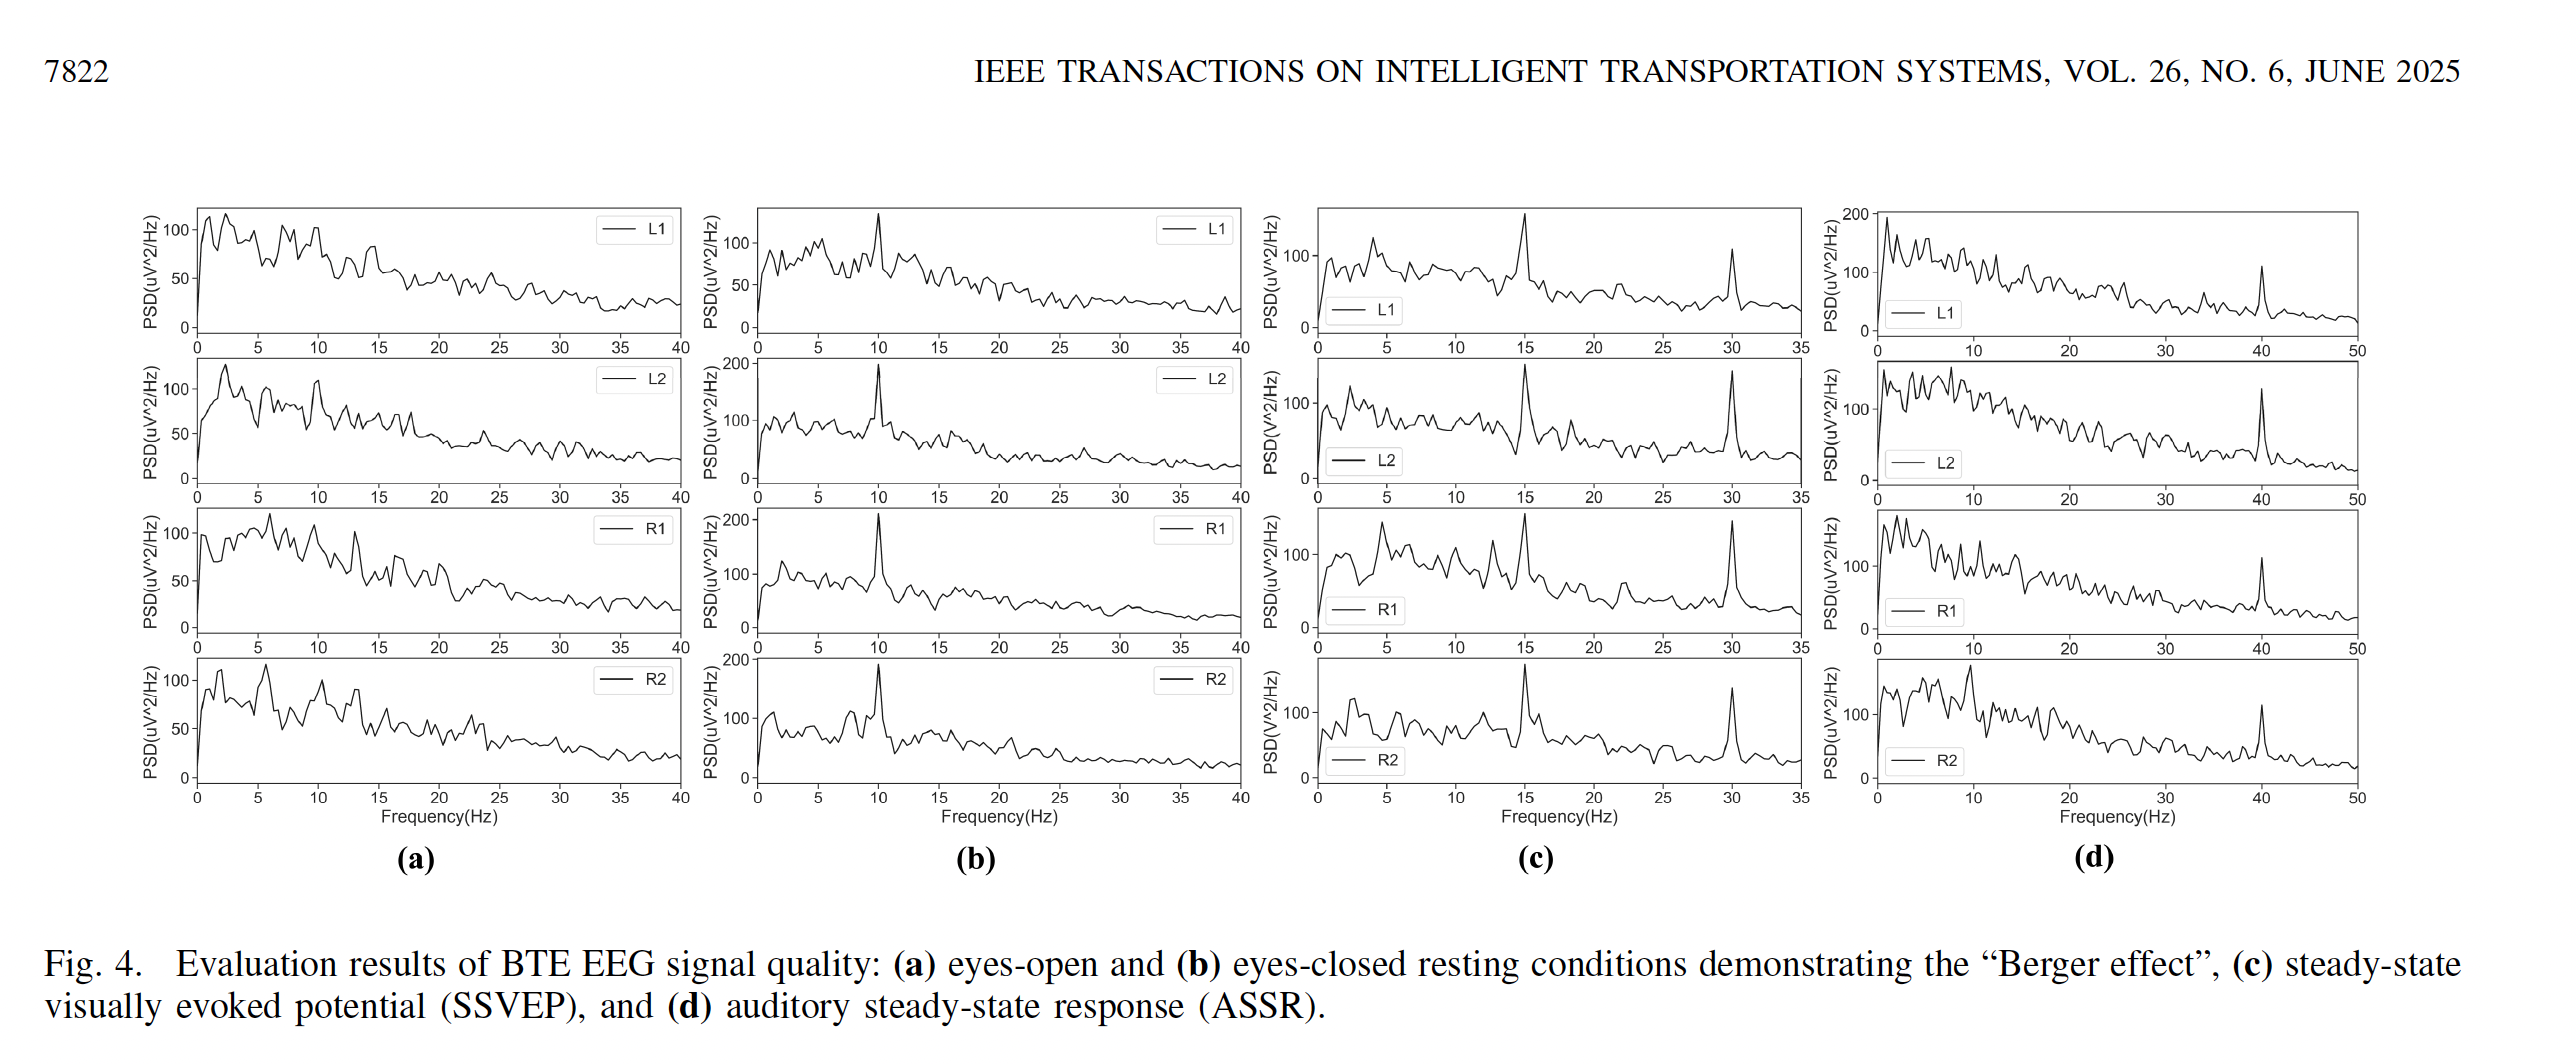
This led me to think alpha peaks would be absent from around-ear FFTs. But then I came across this paper on around-ear drowsiness detection, where their Welch PSD plots from around-ear data show a clear alpha increase with eyes closed. That surprised me.
I wrote a script to:
1. Load saved OpenBCI .txt data
2. Apply 0.5–60 Hz bandpass + power-line notch filtering
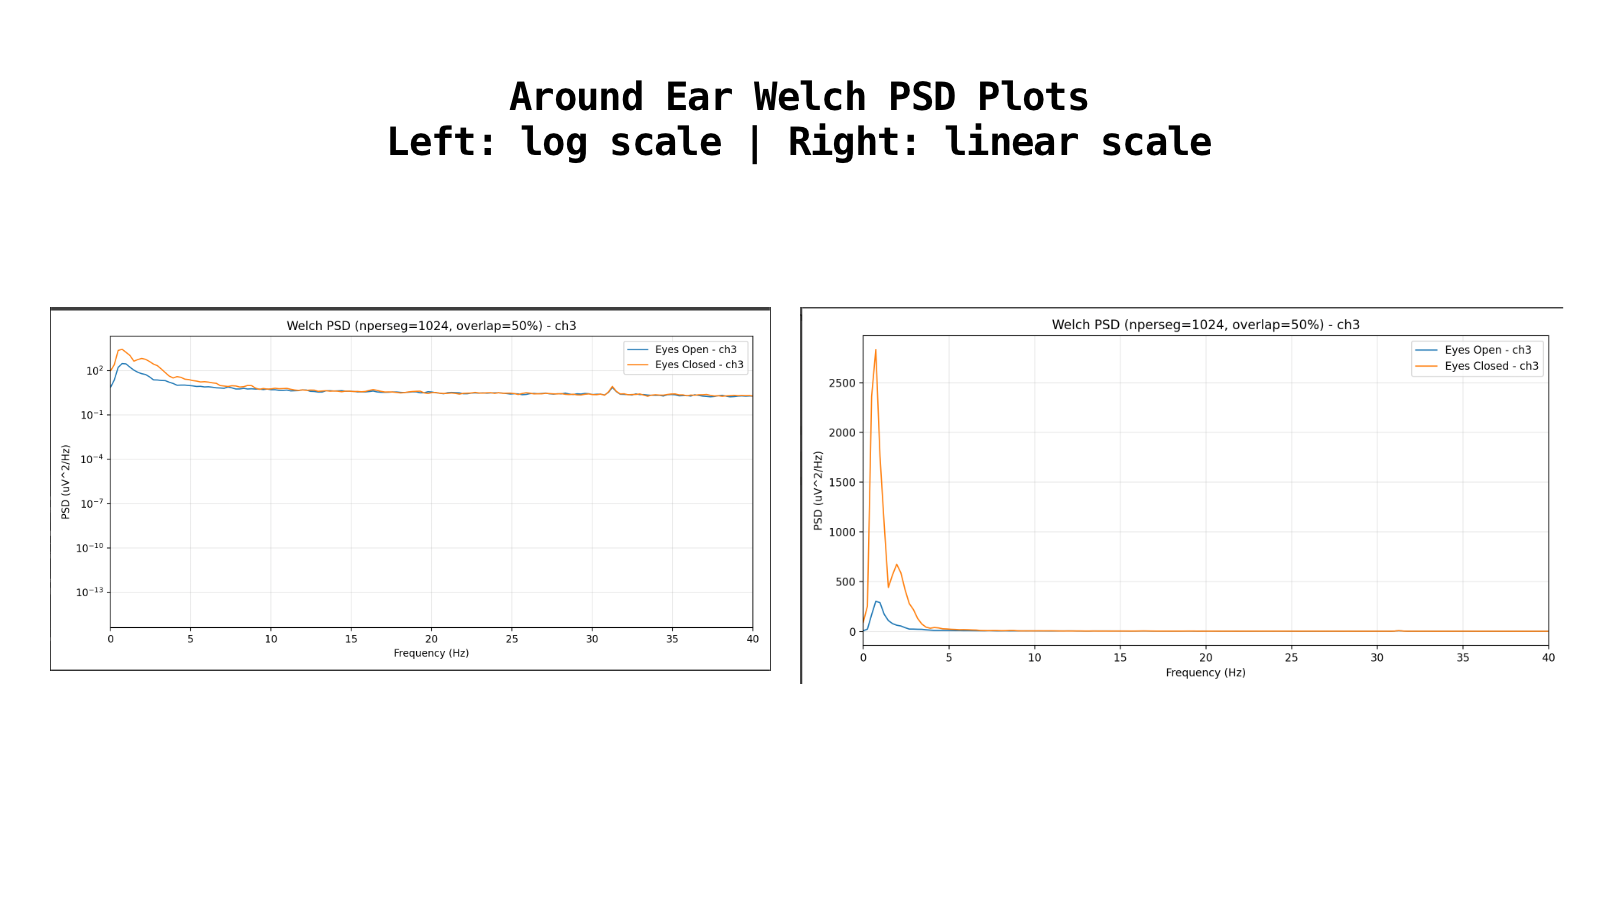
3. Plot Welch PSD for both around-ear and O1 recordings (eyes open vs eyes closed)
Here’s the confusing part: my PSD plots (both linear and log scales) show no clear alpha-band change in either around-ear or O1 data — even though the live FFT for O1 clearly did.
I’d really appreciate help understanding:
1. Could my PSD script be incorrect or mismatched with how the paper computed theirs?
2. Should a strong around-ear alpha response appear in the live OpenBCI FFT at all, or is it only evident in averaged PSD plots?
3. What’s a typical closed/open Welch PSD ratio for alpha in around-ear vs O1 data? (For reference, I got 1.227 for around-ear and — unexpectedly lower — 1.131 for O1.)
I've attached the paper's plots (figure 4), and the Welch/FFT plots I generated and have been referencing.
Thanks in advance — I’m trying to figure out if this is a data-processing issue, a hardware limitation, or just an expected difference from electrode placement.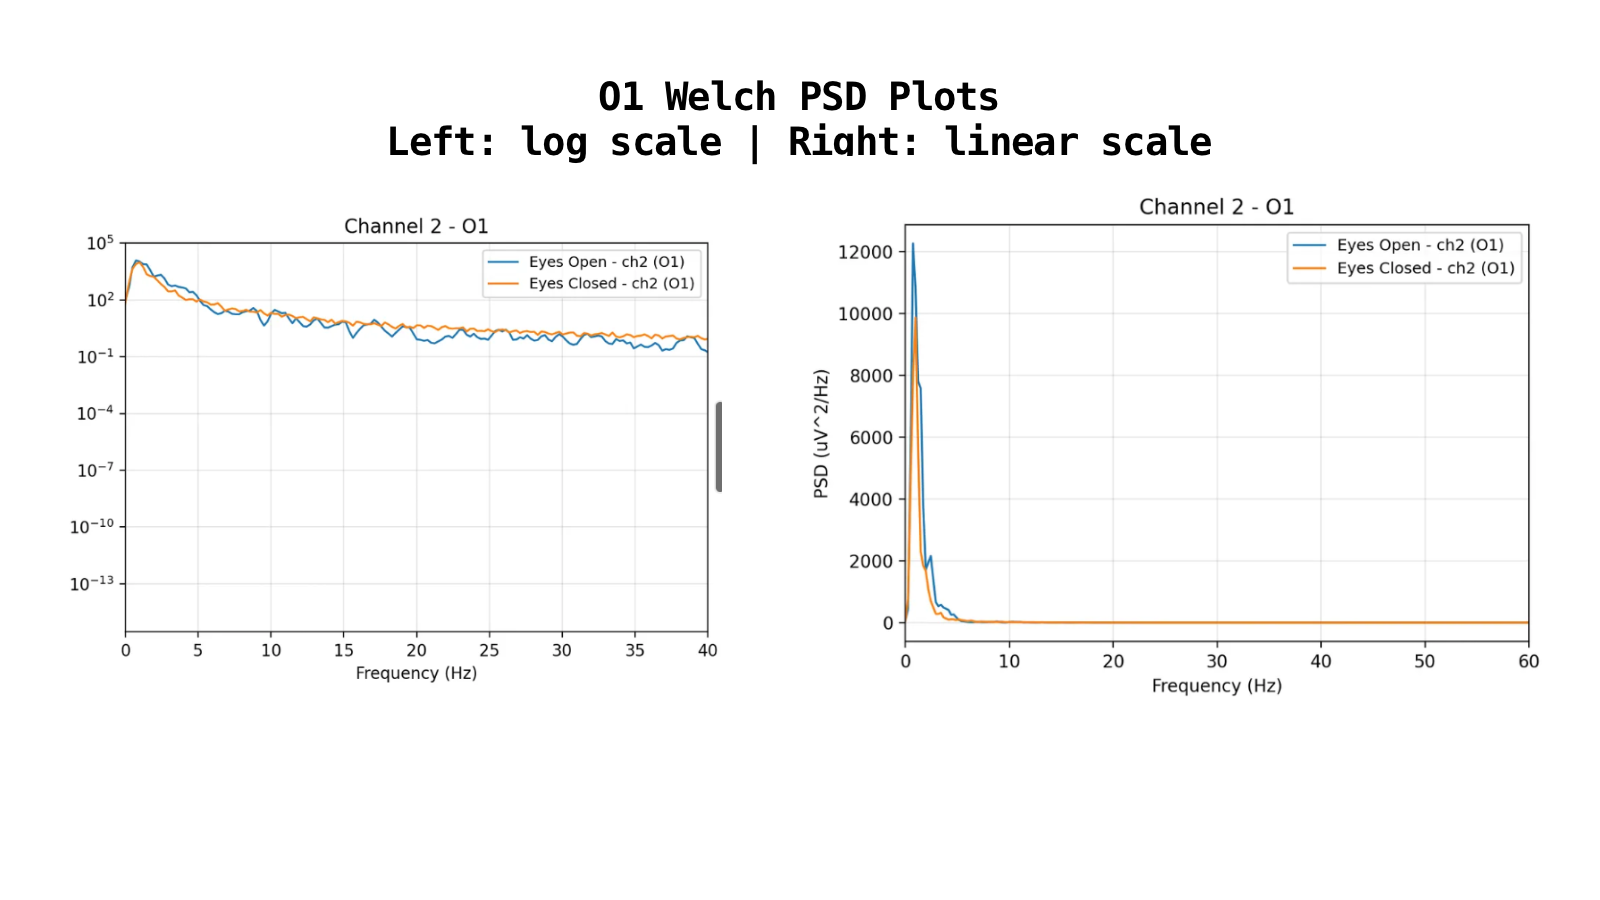
Comments
Hi,
I've asked OpenBCI staff to comment on this thread. Be patient it may take a few days. The primary cEEGrids expert is:
https://im.win.kit.edu/team_1261.php [Michael Knierim]
I've reached out to him via email and expect he will comment here. He first needs to register on the Forum.
Regards, William
Hi there!
interesting question! From my own experience, the Alpha power peak is typically well-visible during eyes-closed rest with cEEGrids. There are more articles with cEEGrids that show this:
Debener et al. 2015 - https://www.nature.com/articles/srep16743
Knierim et al. 2021 - https://www.tandfonline.com/doi/pdf/10.1080/2326263X.2021.1972633?casa_token=LuFJAVVYO34AAAAA:BRg-enD9yrC7FpcaStrfY4PNY8ZfAOEyICR6xHxKPHjyAggPp5KJt5Yg9tPKJIZ4slQ2VnjD9OD5M0Y
So I think it should definitely be there. About the live-view I don't really know, because I didn't look at it during eyes-closed rest Also, due to several factors (small inter-electrode distances or skull thickness and skin properties attenuating signal amplitude) it varies how clearly Alpha power is visible in eyes open rest. That said, your best bet is to look at the eyes-closed rest PSD.
If you are not seeing the Alpha peak during eyes-closed rest, there are several possible reasons:
1. Poor electrode contact - did you have signals on all channels? Or were several RAILED?
2. Artefacts (e.g. from movement) can lead to unstable PSD figures. You could make them more reliable by using median aggregations of the welch windows (I recommend the mne python package for that step: https://mne.tools/stable/generated/mne.time_frequency.psd_array_welch.html).
3. Get a sufficiently long recording (60 sec should totally suffice - shorter should work too, but just to be sure for now, a longer window helps)
4. Zoom in on the plots - especially with the linear scale, some of the details you are looking for might be hidden (go to <100 db Power on your y-axis. I like to use plotly figures to do that dynamically...)
5. Check that you have specified the correct sampling frequency in your scripts filters. Because the plots might seem to indicate the presence of the Alpha peak, but according to the x-axis on a much lower frequency…
Best regards
Michael