
CytonDaisy Wifi board (reset or update)

Hi,
I have the CytonDaisy Wifi board, and I have upgraded the firmware from your website to 2.0.5 while following the instructions.
I am using brainflow library in Python to get the data, but the data I am getting is not the same as the one showing in OpenBCI GUI,
The python code is frequently not able to prepare streaming session even though the board is connected to my laptop(Direct connection).
Can you help me with this issue and sort this out with any tips or upgrades.
@wjcroft @retiutut
Comments
Ananth, hi.
Can you please confirm where you purchased that system? OpenBCI has not sold the Wifi Shield for a LONG time. Is it possible you purchased that from China? Those clone boards are notorious for not working correctly. Not recommended.
Additionally, the Wifi Shield was discontinued in the Shop, because Cyton users were having issues. (The Shield was working fine with Ganglion.)
William
Hi,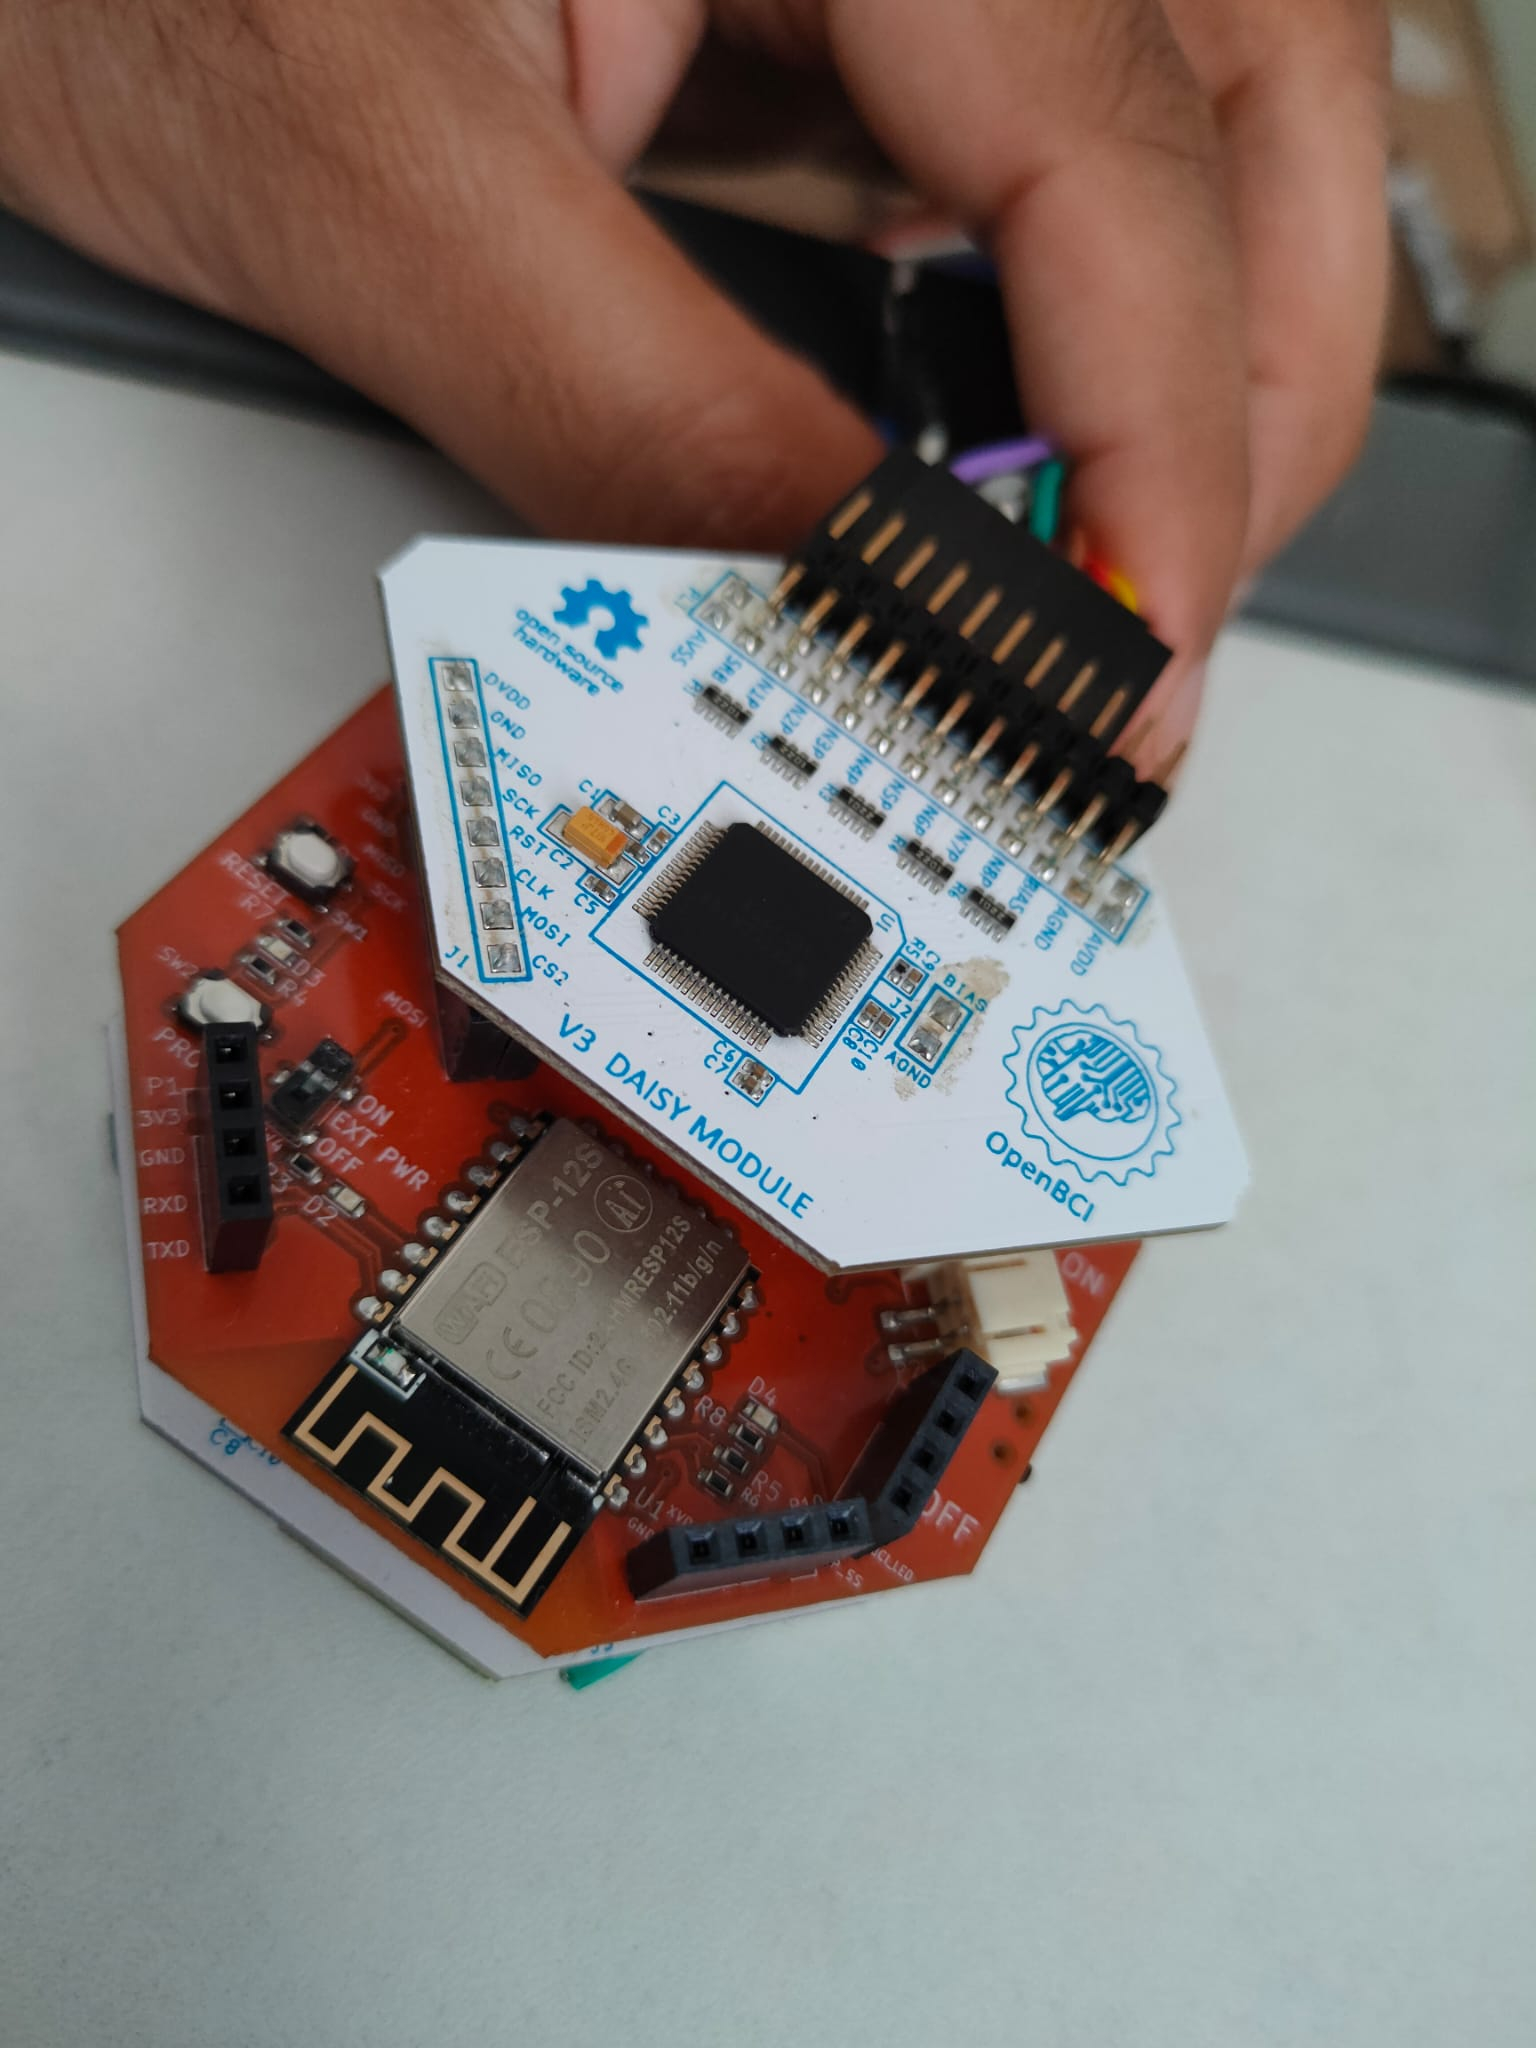
I am not exactly sure, but they ordered the whole set of OpenBCI (wifi, bluetooth, etc) atleast 3-4 years back. It was ordered by university and I am using it now in the Robotics lab
It has FCC ID: 2AHMRESP12S
@wjcroft @retiutut
Since we already mentioned that using Wifi Shield with Cyton has issues, your most reliable connection will be WITHOUT the Shield. Just use the Cyton dongle. In some cases the Shield may work, but you will likely encounter noise bursts.
re: "the data I am getting is not the same as the one showing in OpenBCI GUI"
Have you removed the DC offset? The GUI screen image has been prefiltered. The recording file and Brainflow stream is NOT filtered.
William
Hi,
I don't know what is meant by DC offset, but yes I am using the same bandpass filters, notch, etc for the signal directly from wifi board.
for count, channel in enumerate([eeg_channels[6], eeg_channels[7]]):
# Filtering in place
data_mean = np.mean(np.array([data[eeg_channels[6]], data[eeg_channels[7]]]), axis=0)
f_low = 5, f_high = 50
DataFilter.perform_bandpass(data_mean, sampling_rate, f_low, f_high, 2,
FilterTypes.BUTTERWORTH.value, 0)
DataFilter.remove_environmental_noise(data_mean, sampling_rate, 0)
fft_data = DataFilter.perform_fft(data_mean, WindowOperations.HAMMING.value)
f_axis = np.array([(sampling_rate / (len(fft_data) - 1)) / 2 * i for i in range(len(fft_data))])
plt.plot(f_axis, abs(fft_data))
This is the code snippet I am using with brainflow library, to get mean of the channel 7 and 8.
And I am getting a fft_plot with really high value of peak (500000) at the starting value of bandpass, and I am not sure why is that.
Also, something is broken on the cyton daisy board, probably the bluetooth module(bluetooth is not working) and that is why I am using WiFi board. @wjcroft @retiutut
Thank you.
https://openbci.com/forum/index.php?p=/discussion/201/large-millivolt-data-values-fbeeg-full-band-eeg
"DC offset" is EEG below .5 Hz. This is removed typically by a bandpass from .5 Hz to say 45 Hz.
Purchase a new dongle here:
https://shop.openbci.com/products/dongle
The dongle is fine, but a small chip on the board got detached from the cyton daisy board and I think that is the problem for bluetooth.
Also, according to the attached code, I used a bandpass filter from 5 Hz to 50 Hz. Doesn't that solve the DC offset?
Thank you.
@wjcroft
You may be calling the filter function incorrectly. I'd suggest hopping on the Brainflow Slack and checking with Andrey. Your FFT above is showing absurd value of microvolts. Even with the DC offset NOT removed, it is typically only in the 10's of millivolts, 10000 microvolts.
https://brainflow.org/
f_low = 5.0
f_high = 45.0
for count, channel in enumerate([eeg_channels[6], eeg_channels[7]]):
# Filtering in place
data_mean = np.mean(np.array([data[eeg_channels[6]], data[eeg_channels[7]]]), axis=0)
DataFilter.perform_bandpass(data_mean, sampling_rate, f_low, f_high, 2,
FilterTypes.BUTTERWORTH.value, 0)
fft_data = DataFilter.get_psd_welch(data_mean, samples_acquired_stream, samples_acquired_stream // 2,
sampling_rate, WindowOperations.BLACKMAN_HARRIS.value)
lim = min(70, len(fft_data[0]))
plt.plot(fft_data[1][0:lim], fft_data[0][0:lim])
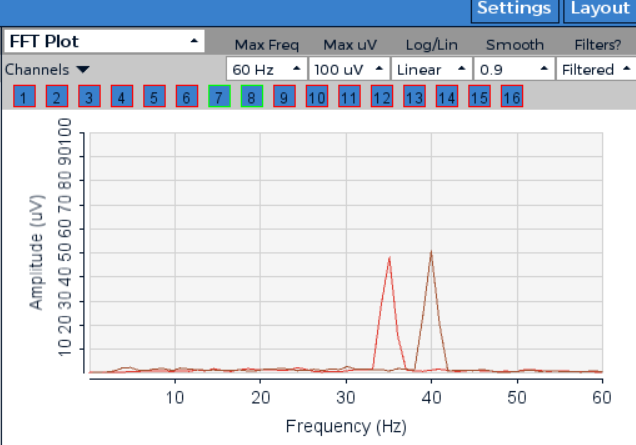
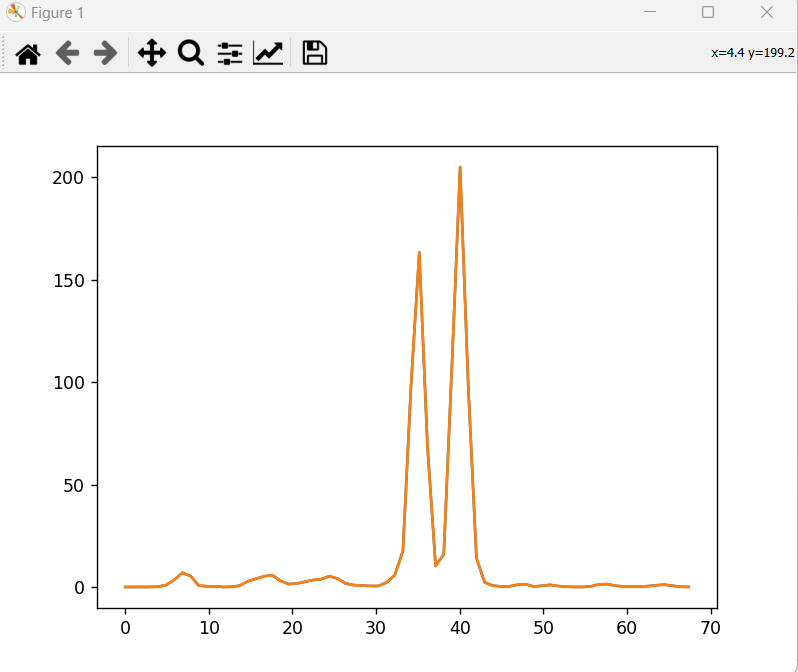
I just tested that with synthetic code data as the cyton daisy wifi board is not accessible at this moment and the attached are the fft plots that I got and the amplitudes are not the same (The figures are from OpenBCI GUI and from the python code using brainflow. In both I used bandpass filter (5Hz to 45 Hz) with butterworth, order 2) and I am not sure regarding what window the GUI is using but if it's Hamming window, that is giving more amplitude than blackman harris window), I am not able to figure out what's the issue here.** I am asking this because, at least the fft plot for the synthetic data should have been same, why is it different?**
Note: Since I took mean of channel 7 and 8, the amplitudes are almost half of what would have been if I would have taken separately.
@wjcroft
Thank you.