
Why does my EEG (FP1) signal not look right?
 nirajgupta
California
nirajgupta
California
Hardware setup:
Ganglion board is connected to 4x AA battery pack
switches on Ganglion all set to DOWN position so that EEG channels are a differential input between pins +1 to +4 and REF
USB BLE dongle connected to PC running OpenBCI GUI
Make sure blue LED on board is steadily on to indicate it is paired to the dongle before streaming data
One earclip connected REF (top) pin
One earclip connected D_G (top) pin
FP1 electrode connected to "+1" (top) pin
software setup:
use default settings in OpenBCI GUI
Description of problematic EEG readings:
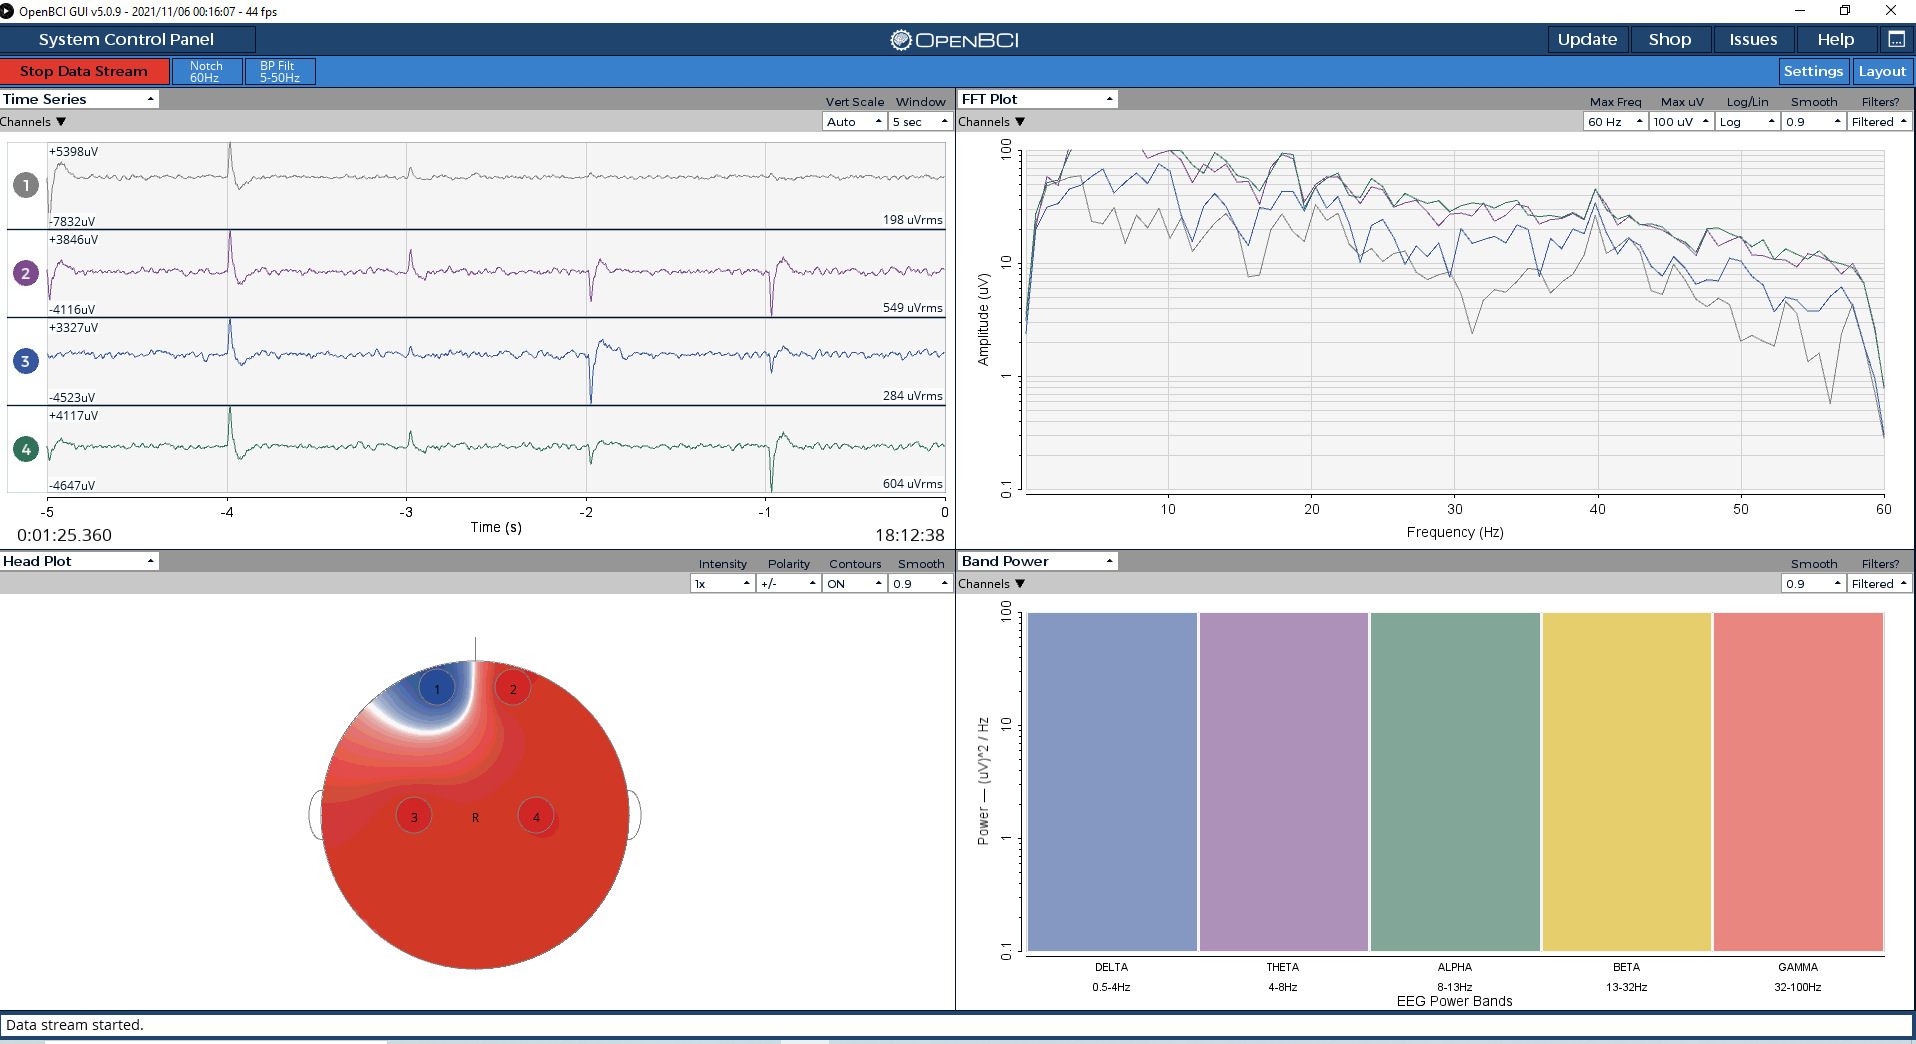
Time series values vary from around 3000 uV to 8000 uV
Time series shows similar noise across all channels (0 to 3)
FFT plot shows power is around 100 units across all frequencies
band power is saturated across all frequency bands
Head plot looks unusual
FP1 channel time series does not change at all when eyes are opened or closed
Comments
Has this Ganglion EVER worked correctly? If this is a new board and it has never worked, you should email customer service at contact at openbci.com.
https://docs.openbci.com/GettingStarted/Boards/GanglionGS/
https://docs.openbci.com/GettingStarted/Biosensing-Setups/EEGSetup/
The once per second noise pulses MAY be a symptom of electromagnetic interference in your local area. Try other locations. Avoid extension cords, wall warts, power supplies, conduits in walls / floors / ceilings, LED or CFL lights, etc. Or similar 1 Hz noise pulses have been seen with broken Ganglions.
re: changes, eyes opened or closed. These are more evident in the occipital or parietal lobe, such as O1, O2, Pz, P3, etc. Frontal alpha in most people is less easily seen.
William
This Ganglion has never worked for me yet, so it might just be broken. I should contact customer service on this. I have tried recording from the temporal area but did not see any sensible signal. I will have to try the parietal and occipital regions next.
Thank you.
PLEASE try running in other locations. The 1 Hz pulses may be resulting from incoming electromagnetic interference due to power cords, power supplies, conduits, etc.
Hi William,
I tried your suggestions to reduce 1 Hz noise: I turned off all lights so that the only light source was daylight. I moved my board farther from the wall outlet. And I unplugged my PC's charger in case that may have some effect.
Here are the results:

This is showing 20 Hz noise in both the time series and FFT plot. uV amplitude are not in an acceptable range (1000s of uV apart)
For a while, the freq. band plot was completely saturated

For maybe 30 sec., I got what seemed like a normal signal. I was able to verify the presence of forehead movement artefacts in both the time series and head plots

Then, the same 1 Hz noise showed up again somehow

I can attest that I have ensured the FP1 electrode was firmly pressed against my scalp the entire time. As per previous impedance tests, I don't think skin-electrode contact is the issue
The 20 Hz noise present in your first image, could likely be a 'sub-harmonic' of the 60 Hz mains frequency. Even though you have the 60 Hz notch turned on. The electromagnetic noise in your environment may be SO strong, that it is swamping the Ganglion.
In previous comments, I suggested you MOVE your experiment to a different environment, different room. The adjustments you did make, may not be enough. Large EMF fields exist around each conduit (walls, floors, ceilings), extension cord, etc.
It will be pretty inconvenient for me to find another location since I have roommates and there isn't a lot of space. Is there any additional filtering I can try? How do I know where the EMF fields are coming from? Is there some kind of handheld device I can use for that? How likely is it that the board is broken?
The strong 20 Hz evidence in your first image, points at electromagnetic field contamination. Mains EMF fields subside after a few feet distance. But they are ubiquitous in buildings, since every floor, wall, ceiling is likely to carry conduits. Also some floor materials, such as concrete with embedded rebar, can also channel fields.
https://www.google.com/search?q=android+emf+detector
The phone apps require a magnetometer chip (compass) in the phone for these apps to work. Other than apps, there are many other EMF field meters available. But more expensive, since typical apps are free or paid by ads.
https://www.amazon.com/s?k=emf+meter
This one looks decent, only $33,
https://www.amazon.com/ERICKHILL-Rechargeable-Electromagnetic-Radiation-Inspections/dp/B08BLJM28J/
Thanks for the suggestion of getting a meter. Do you know if these meters can tell me what location the EMF is coming from and what frequencies they are at? Without this, it will be hard to make use of it other than to conclude that there is or is not EMF present (which I know there already is). Also, from what it seems, there is no solution to my problem. The only thing I can do at this point is to move my setup to another location (which I can do for the purpose of seeing if the openbci platform actually works but will make working with the platform extremely difficult for me). I was also thinking of grounding all the input channels so I can observe what the sensors think they are sensing even when no signal is present - which I picked up from an EEG Hacker blogpost.
Did you peruse the app list? Many of these are zero cost. Available for Android and Apple phones that have built in magnetometer; generally present on mid range and up phones. Budget phones may lack the magnetometer chips.
https://www.google.com/search?q=android+emf+detector
Some of the magnetometer based apps may show directions, check the app description. The $33 Amazon meter and most inexpensive EMF meters, only show field strength in one axis (x, y, or z). You have to move around the meter in your area to get an idea of the field shape. Higher priced EMF meters can sometimes show frequency. You don't need frequency readout as your EMF source is likely mains wires or power supplies. 20 Hz is a 'subharmonic' of 60 Hz.