
High low-frequency energy in EEG signal
 Sixian
G11 6BZ, Partick, Glasgow City, United Kingdom
Sixian
G11 6BZ, Partick, Glasgow City, United Kingdom
Hello,
I am trying to use cyton to measure EEG signals. What puzzles me is that the signal quality looks good, but the frequency spectrum of the signal looks strange. Below is the spectrum distribution I got by python. You can see that the alpha brain waves are around 10 Hz. However, there is high energy in the low frequency region, which is very unreasonable in my opinion. I have performed 1Hz-40Hz band-pass filter on the data before drawing.
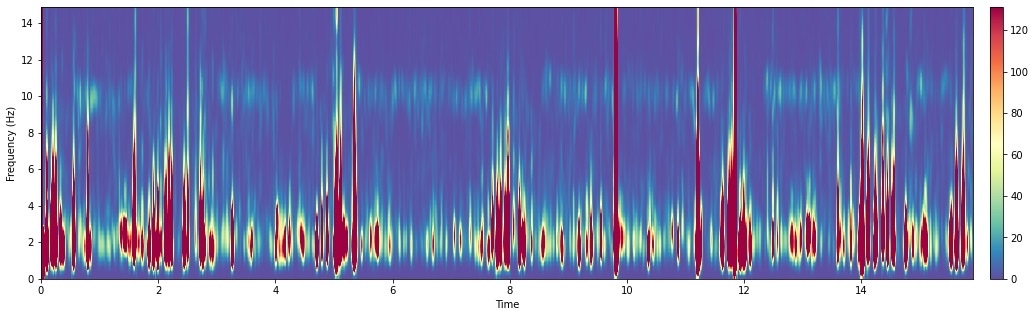

Please tell me if this is normal. If not please tell me how to fix it.
Many thanks!
Comments
Try comparing your own graphs with those produced by the OpenBCI_GUI Spectrogram widget.
The graph produced by the OpenBCI_GUI Spectrogram widget shows that there is also high energy in the low frequency region. But there is no particularly obvious spectral energy distribution around 2 Hz.


The PSD of EEG is shown below.
I don't think you tried the actual spectrogram widget,
https://docs.openbci.com/docs/06Software/01-OpenBCISoftware/GUIWidgets#spectrogram-widget
Sixian, be sure when you monitor via time series, FFT, or spectrogram -- that your EEG is clean. And free from externally created EMF pollution, which can distort the EEG.
The GUI screenshot above, FFT window, is actually bandpass filtered from 5 to 50 Hz. As shown in the filter setting in the time series window.