
new Cyton, GUI error: "check that the device is powered on..."

Hi @wjcroft and @retiutut,
I received my Cyton board V3-32 last week. I have been trying to run it on OpenBCI GUI since then, but unfortunately I could not. I have faced many issues and could not solve them. I followed every single solutions on Google to solve them but still the board is not working.
I downloaded GUI v.4.2. When I choose the port and press "start session", I got an error as shown in the pic attached.
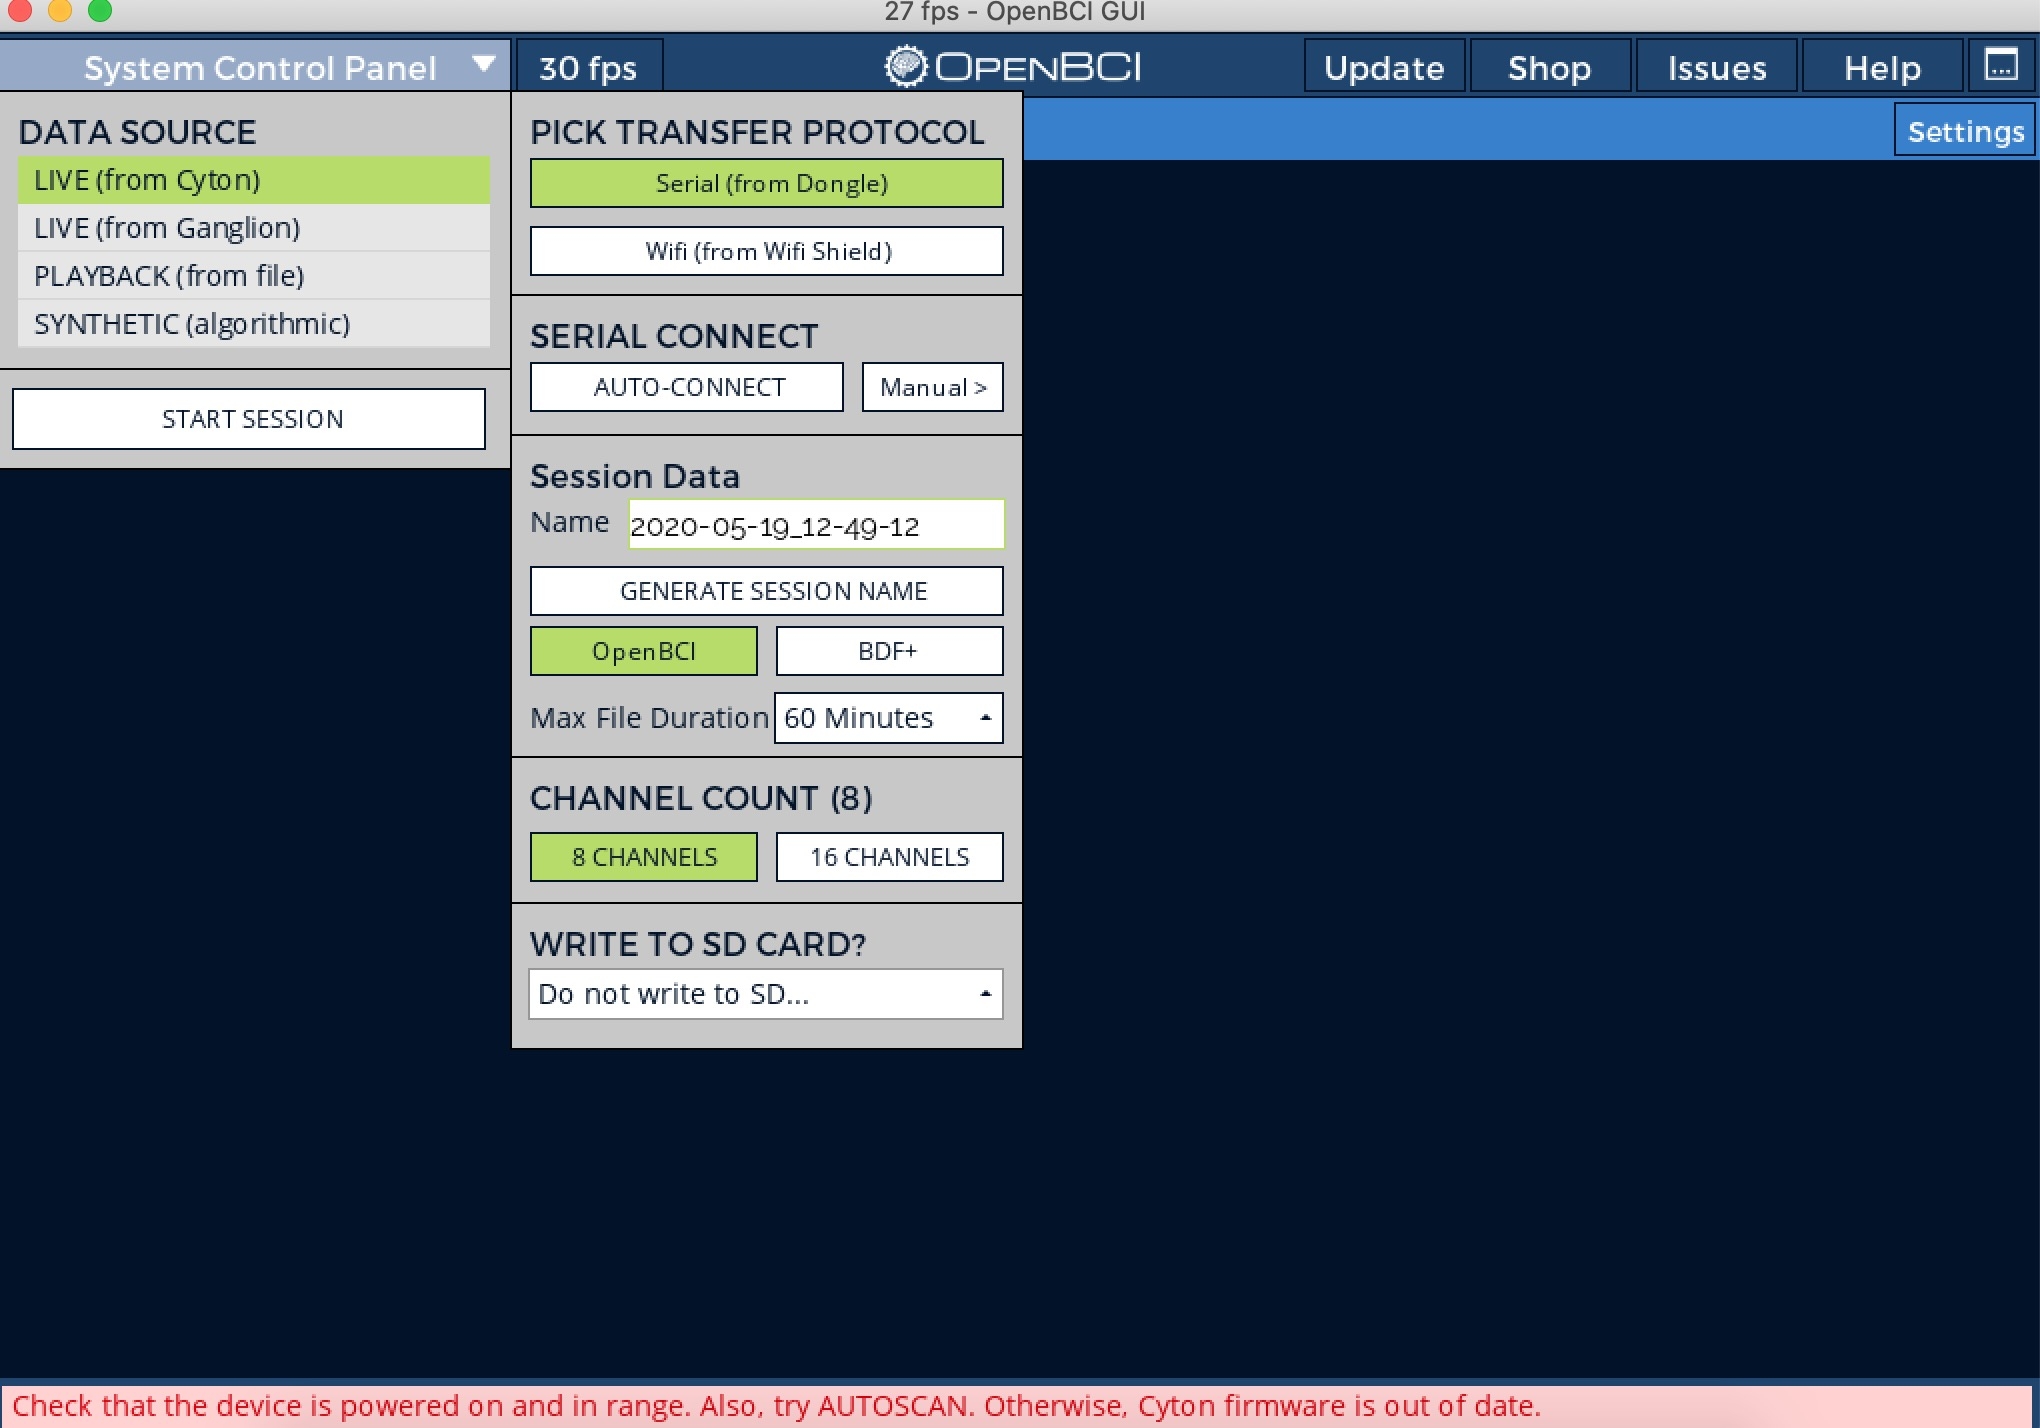
I have updated the firmware but nothing changes! It looks like the dongle is not connected to the board. Actually, it happened once that I pressed 'start session' and the GUI worked, but I couldn't stream any data!
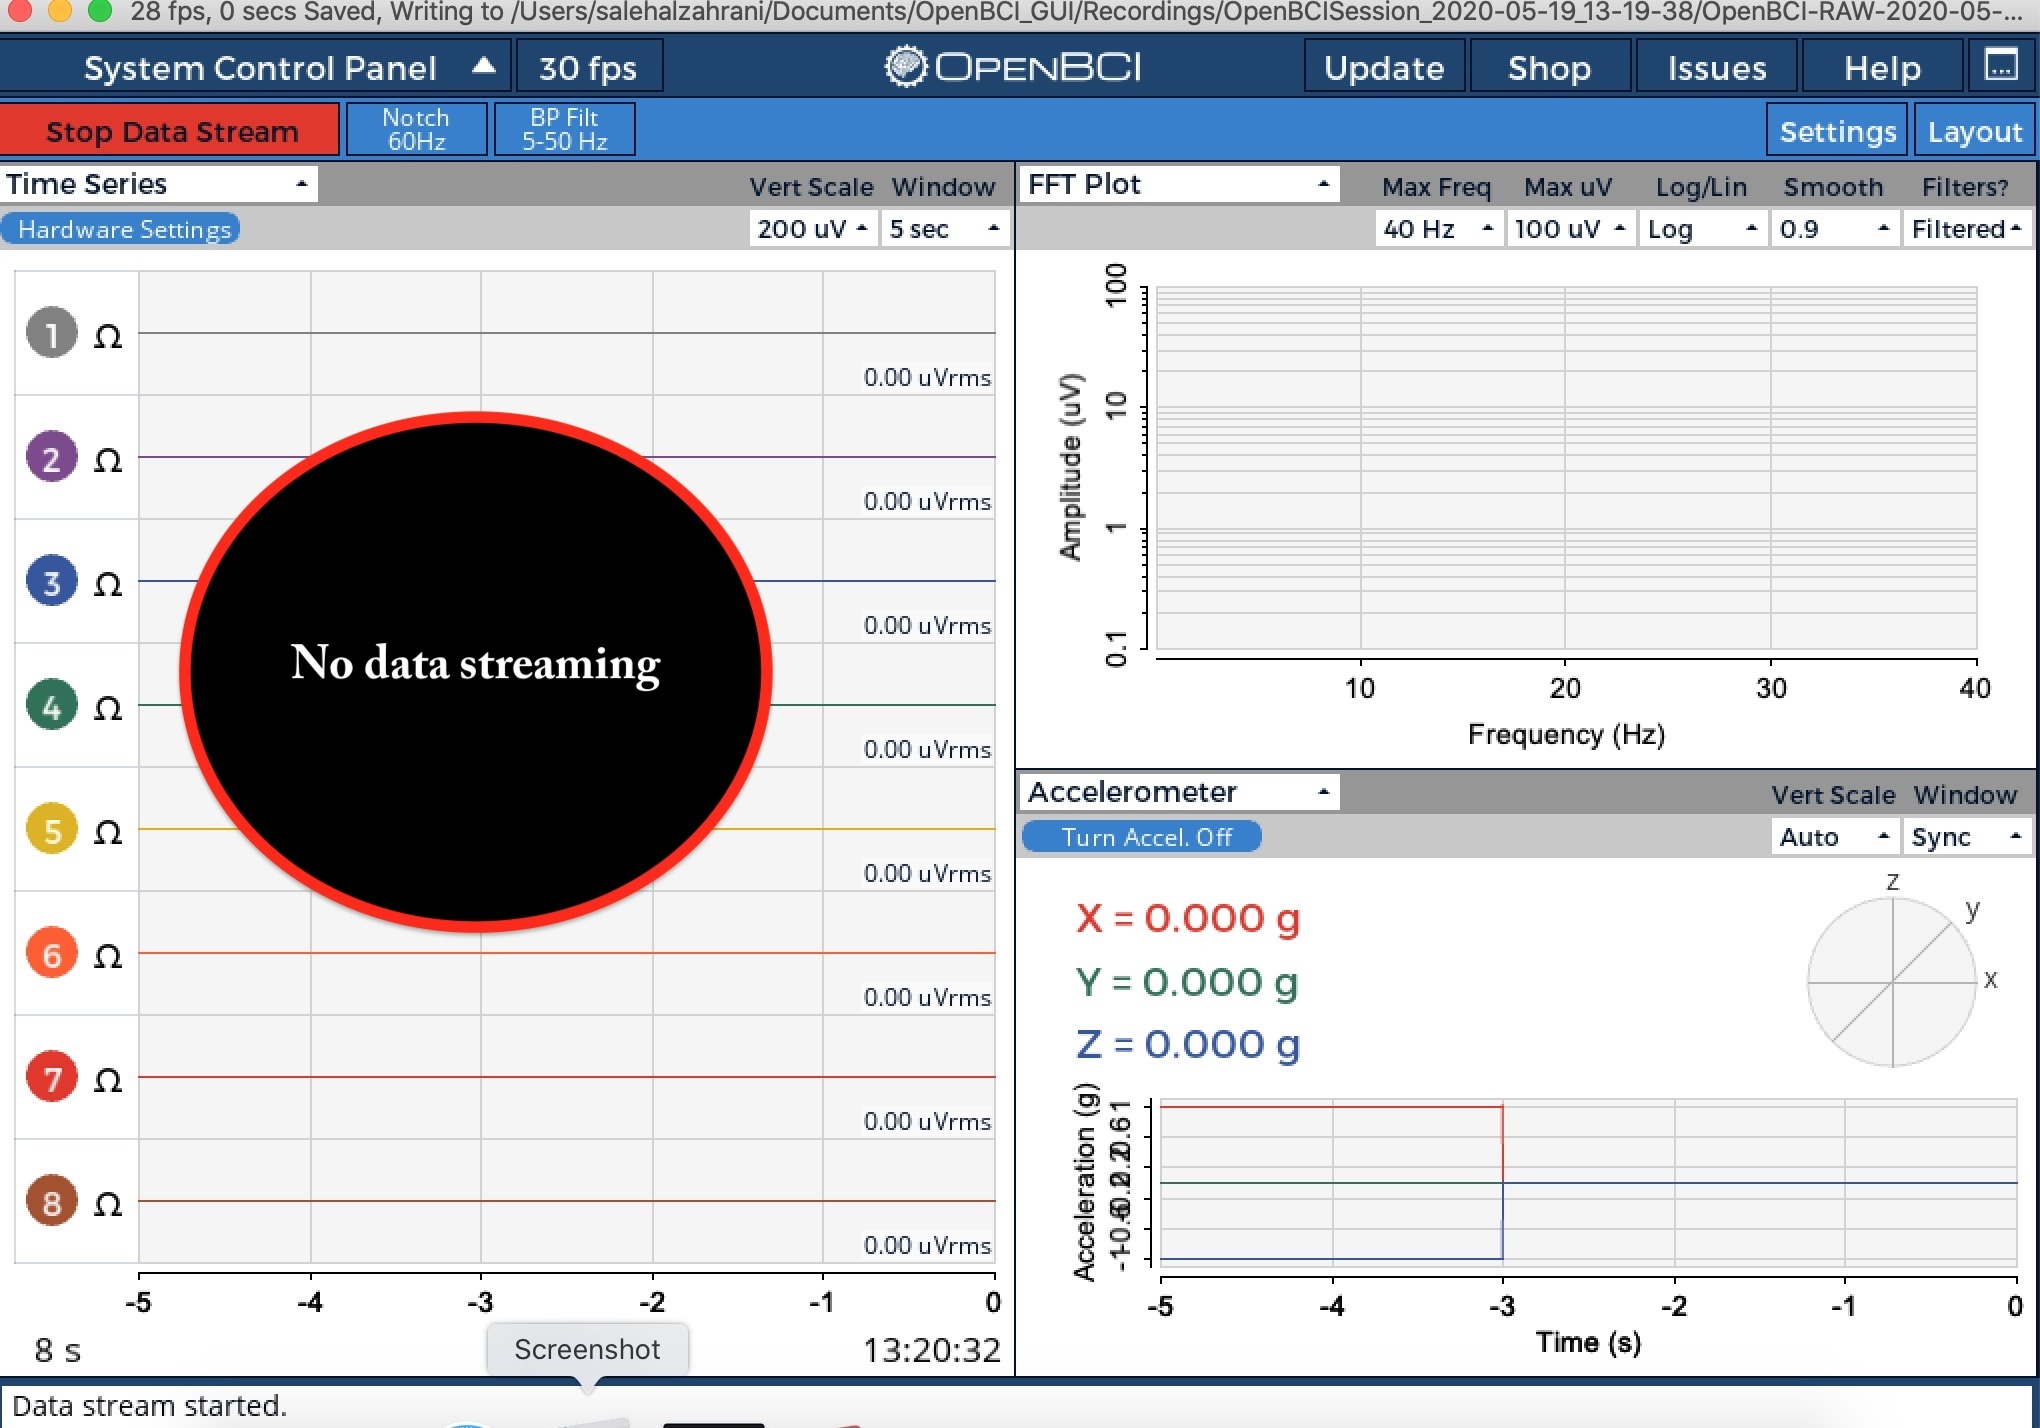
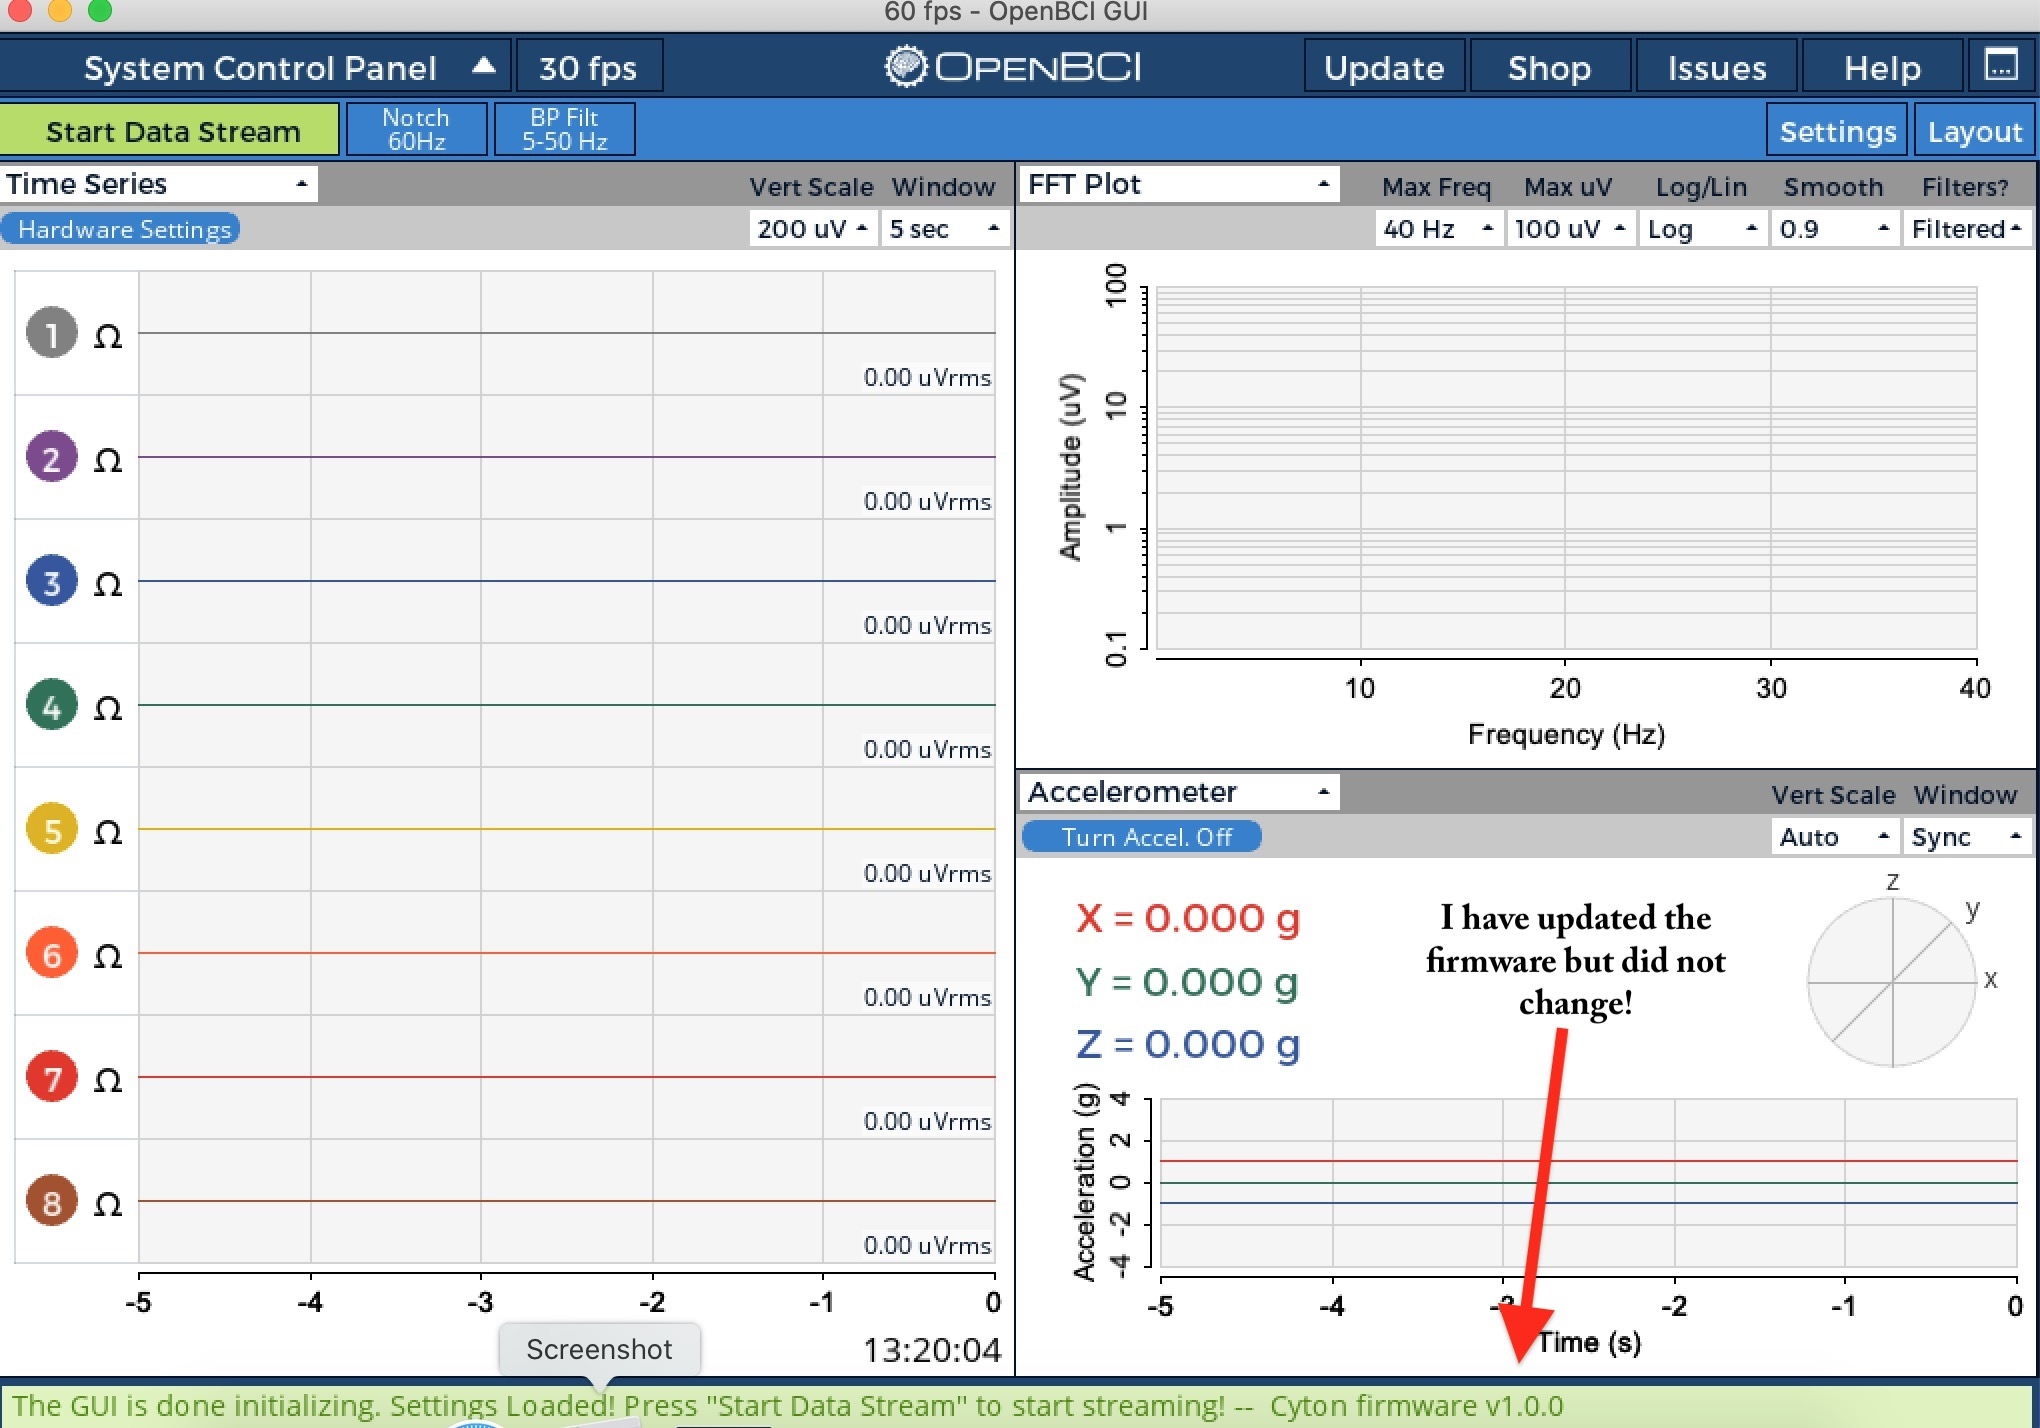
Also, Please check the two attached screenshots. The 'firmware' picture shows the cyton firmware is v.1.0. !! why? I have updated to the last version following the instructions on the Openbci website. The 'no data' picture shows that no data streaming when I run GUI!
Please help me in this regard.
Thank you,
Saleh
Comments
I forget to mention that I'm using macOS Catalina 10.15.3
Please understand that these issues are rare. Cyton is very stable and proven in research.
Please use the AutoScan feature as suggested. We did not say to update the board firmware if you just received a new board! This could be the cause of the problem. There is a very large message at the top of http://docs.openbci.com/docs/02Cyton/CytonProgram that says this.
I will provide a detailed set of instructions based on my experience with the GUI and Cyton board.
Steps to hopefully align Cyton + Dongle and see live data:
After you send us the Console Log and a Screenshot, it should be easier to determine if this is a potential hardware problem.