
why my EEG data is a bigger data?

I have a question to ask you, I test many time, and I never to fell the eegdata is correct, so I learn the tutorial again on your website, I found my data is very bigger than your sample data on website, my problem is : can you help to see what my EEGdata is correct? how can I get the samll data like -24,-23,-22, please look my picture: the first is my EEGdata on matlab, https://drive.google.com/open?id=1lUVMSYwSKPIME6l1e_m6gIjwNy1swAOT
the second picture is your data on tutorial :https://drive.google.com/open?id=1axGzru4V-YNbVzJ4zqD95IcmWgEhiOCE
I hope when I open the EEGdata by Matlab, the data will be is the microvolt data.
Comments
The Cyton data is in microvolts, but also contains a DC offset voltage, on the order of millivolts (thousands of microvolts). So you must use DSP digital signal processing, such as a bandpass filter. For example a common range would be say .5 Hz to 45 Hz. That will strip off the DC offset, and also remove the mains (50 or 60 Hz) interference.
https://openbci.com/forum/index.php?p=/discussion/201/large-millivolt-data-values-fbeeg-full-band-eeg
Regards, William
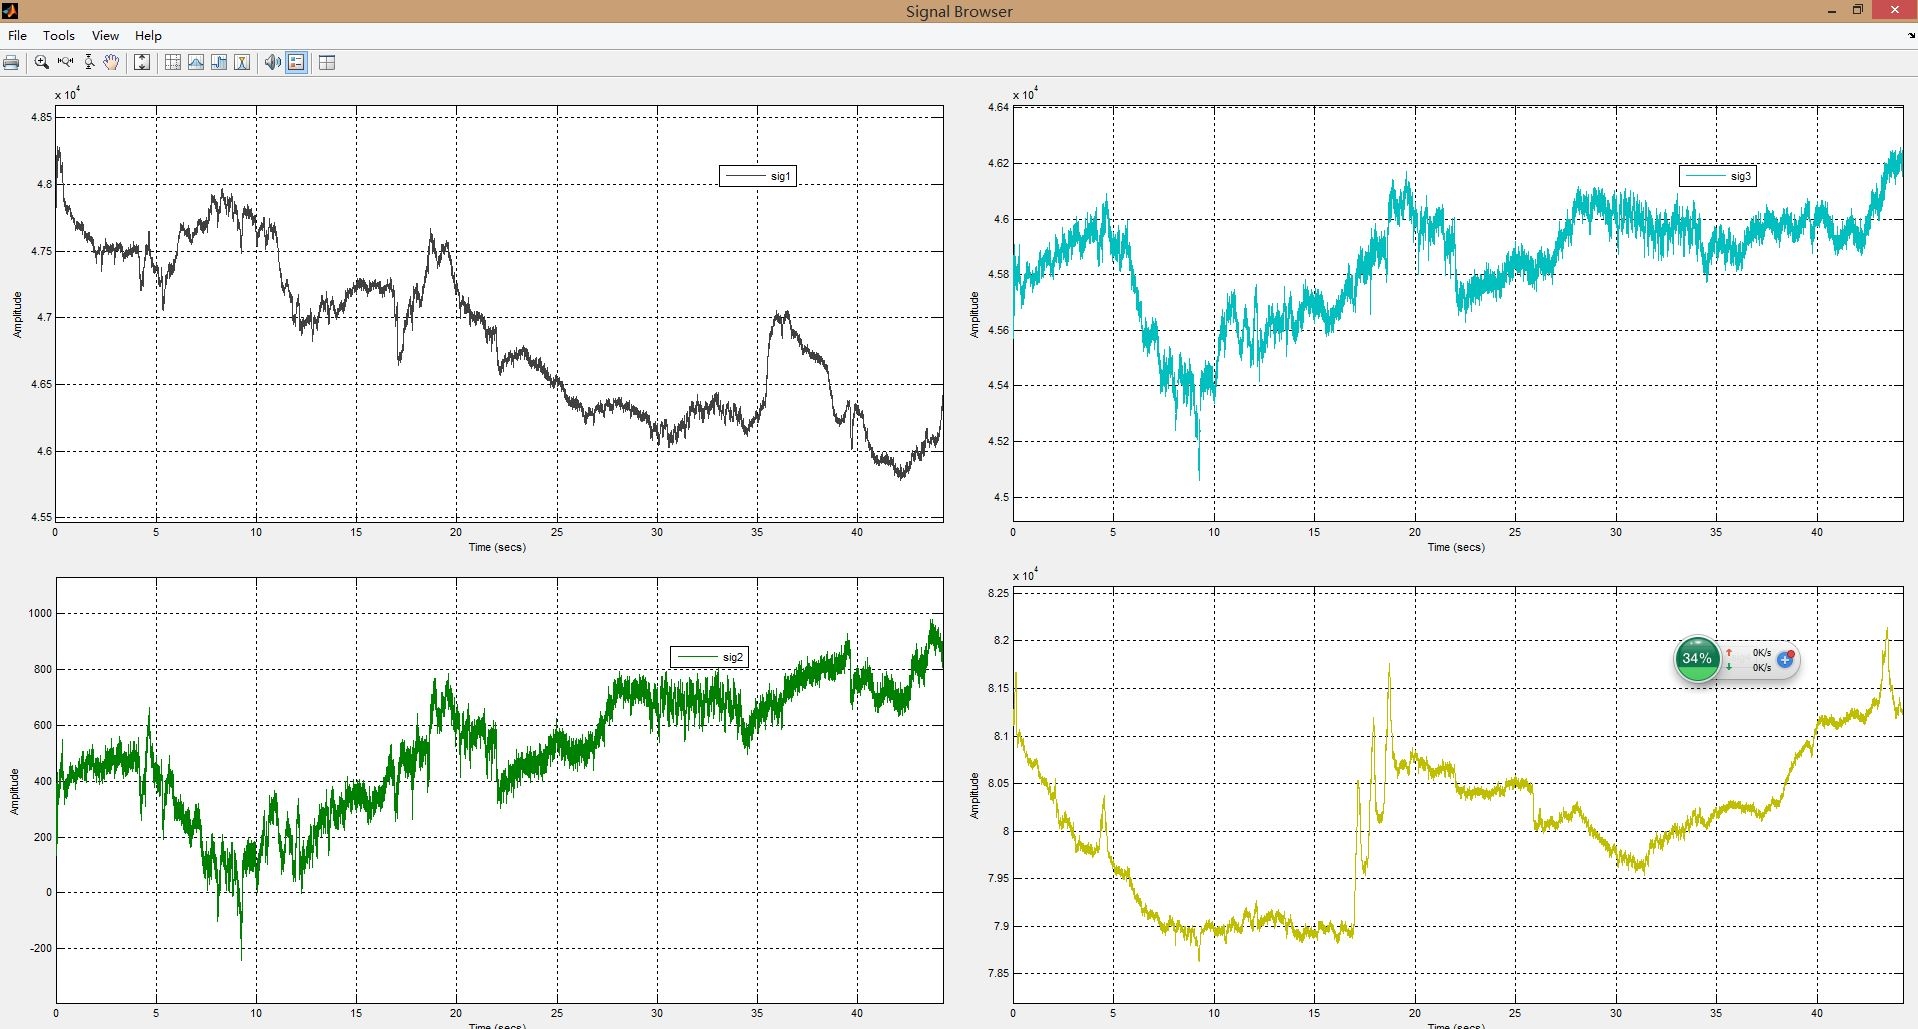
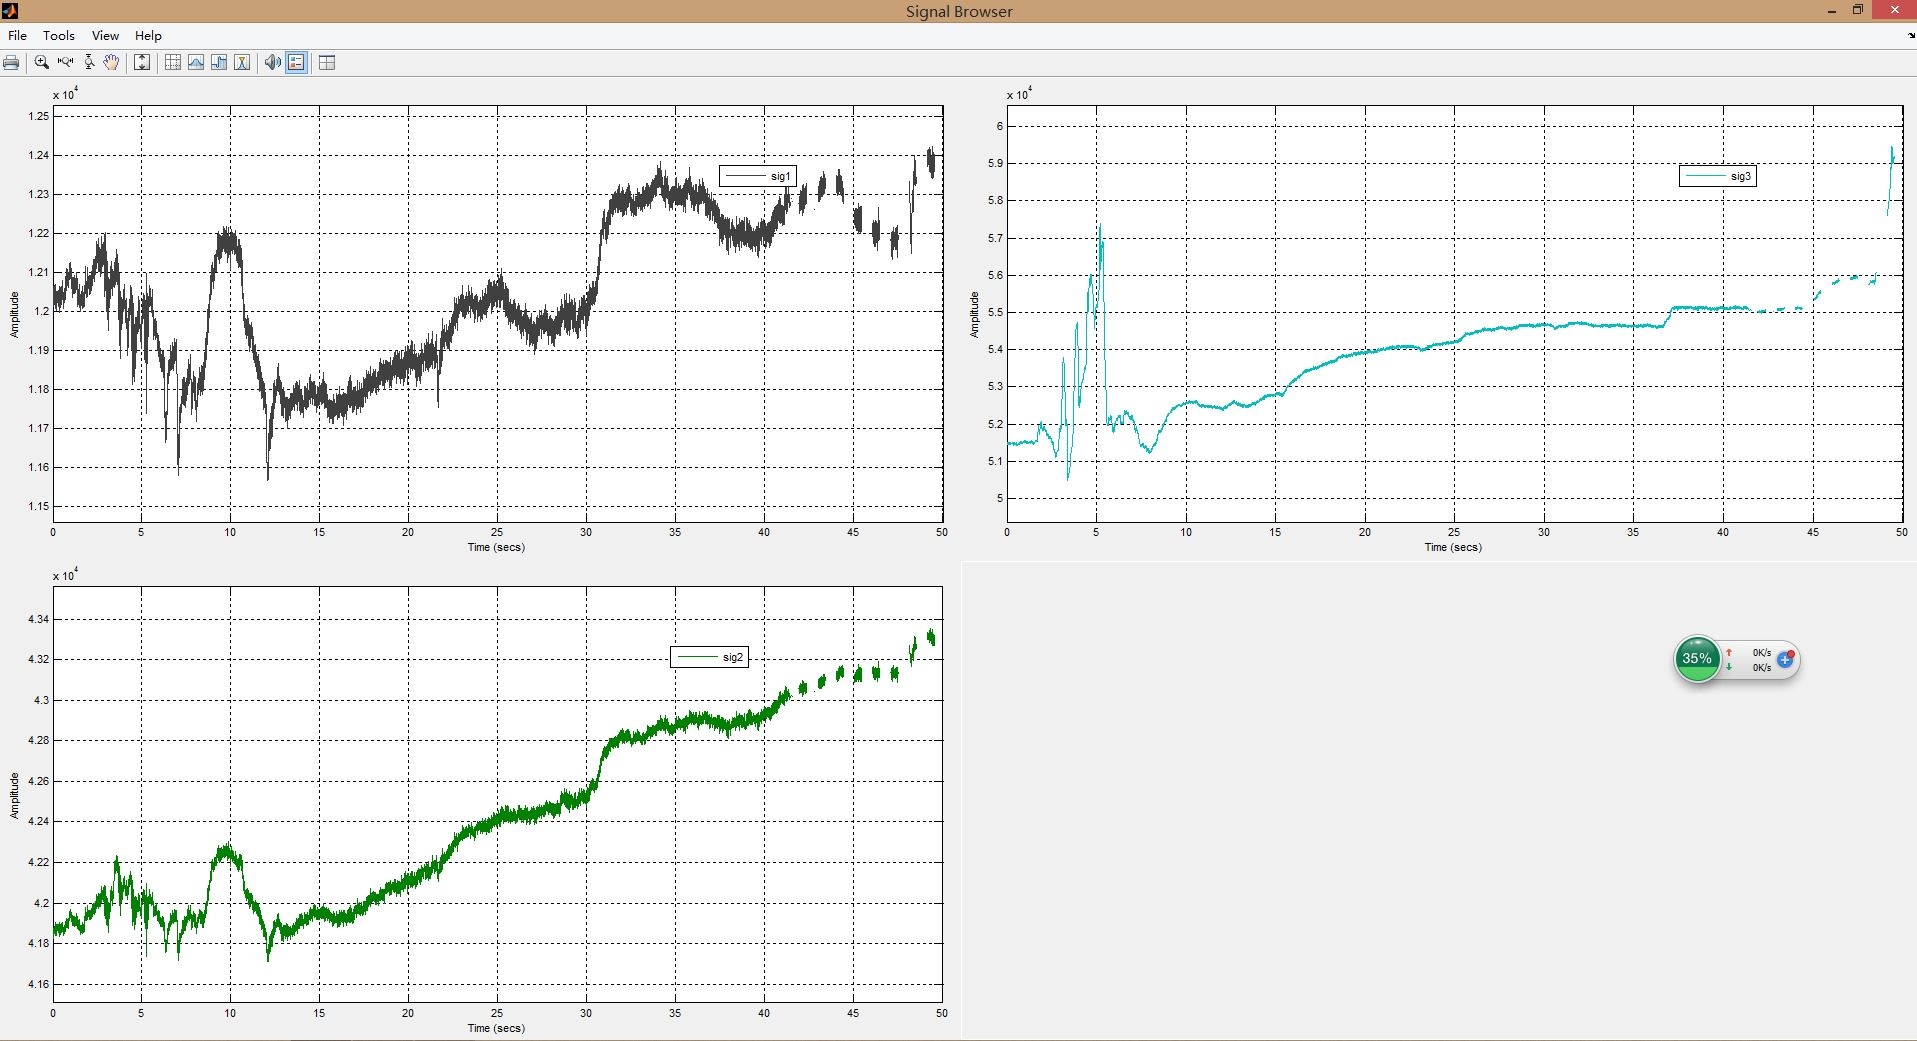
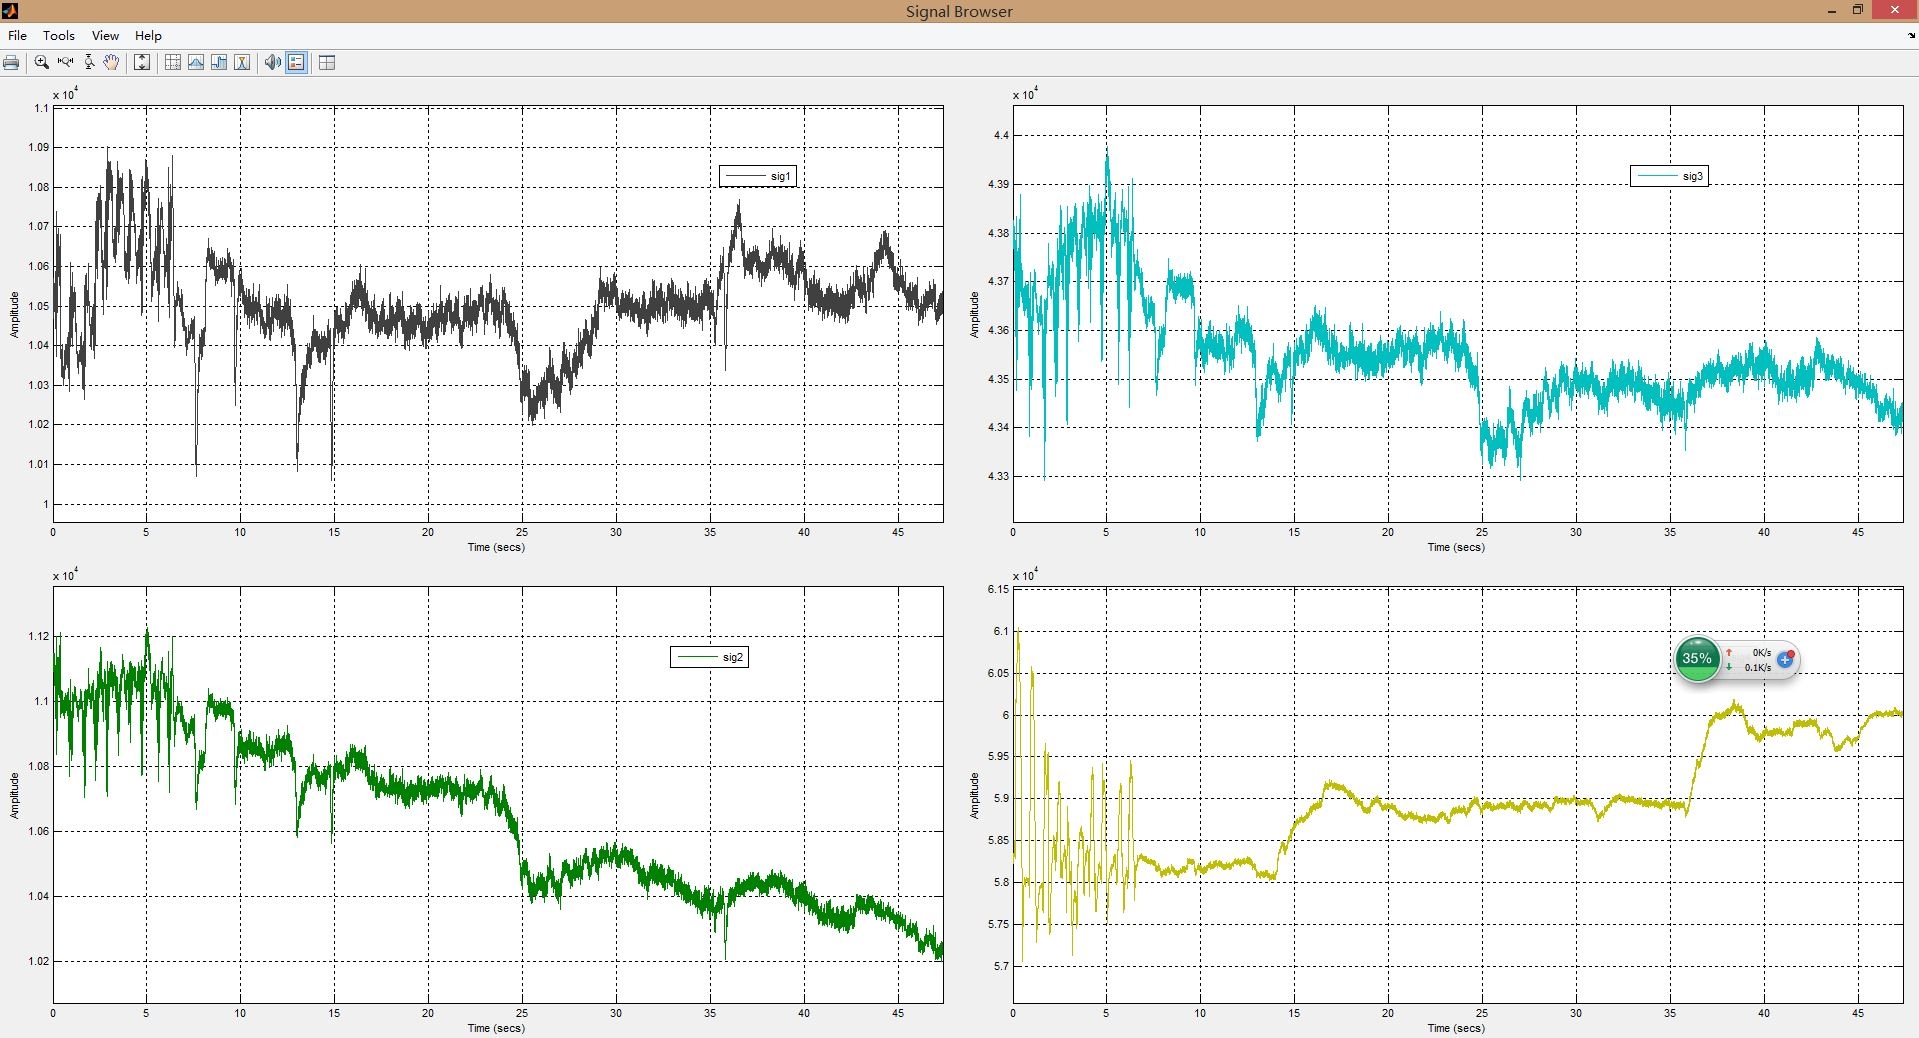
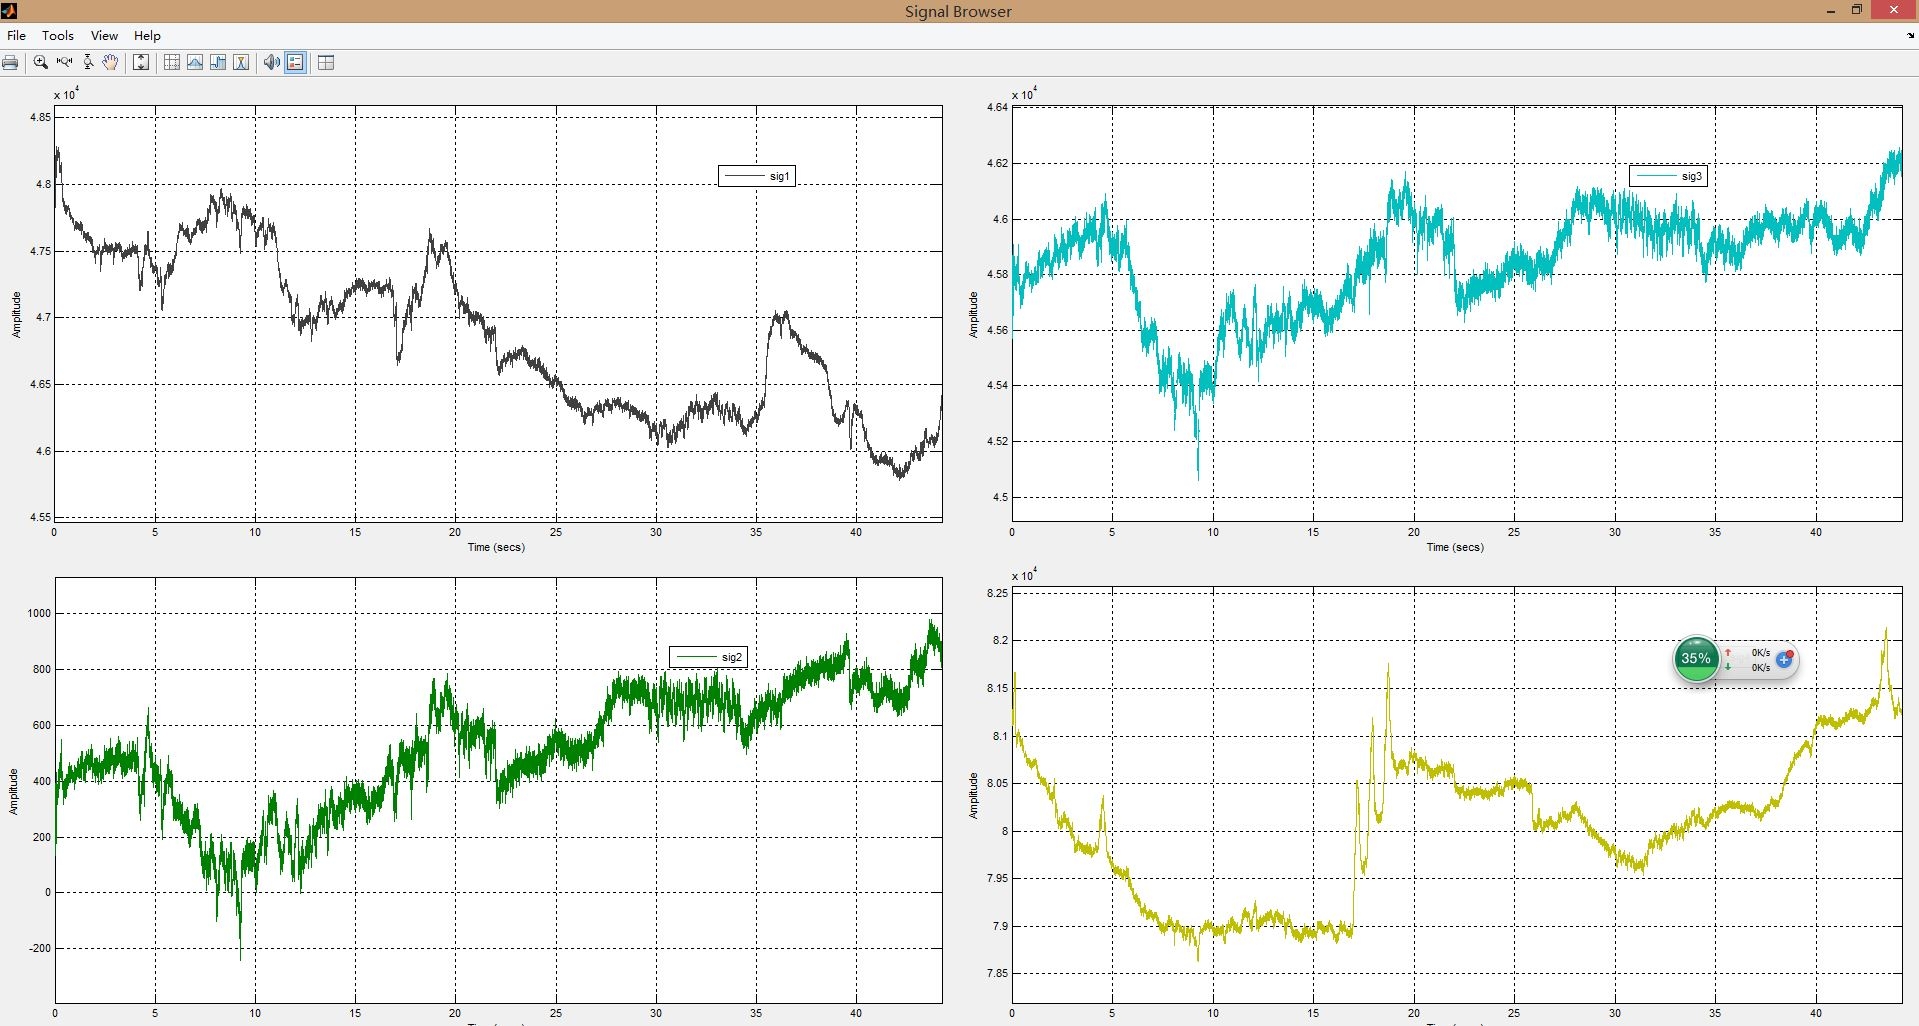
I want give you several picture what I get the data plot recently, can you help me to check, why the data look like to have some problem? Can you tell me what it happen? The data is raw eegdata what it hasn't any filter, thank so much!!!
Dear 'profeell' and 'mark' (who are the same person),
It's confusing when your original username 'profeell' placed the original thread comment. And now 'mark' posts the followup. When both forum names are the same person. In fact in my email to you (both your emails / accounts) today, I asked why you created this new account 'mark', instead of using your original account 'profeell'. It's very confusing, and I'd like you to just use one account or the other, not both. It's helpful to know the person making the comments, and that the person consistently goes by the same name. Thanks. I suggest you stop using one of these accounts, and just use the ONE name from now on.
This data looks like noise. If the data looks ok in the OpenBCI_GUI, that would suggest that your signal processing is suspect.
William
Sorry, I just send a mail to you, I had post a message on the forum, but no people reply, so I think that it is too simply, no people wish to reply. so I register other one account, I get a wiles for reply. Kidding! You may delete mark the account.
yes, the data is good in the OpenBCI, but when I import the MATLAB, it looks no ok, can you give me some ideas, how to process the data, which one kind of digital filter can remove the noise?
After you post a message on the forum, please be patient. It may take a bit of time for a reply.
Do you understand digital signal processing in Matlab? Are you applying a bandpass filter, say from .5 Hz to 45 Hz? I mentioned this previously. You need to compare similar time periods and scale factors for both GUI, and Matlab, to have a valid comparison. Your plots shown all use widely different scale factors
What is your goal?
Thank you so much. I know a little bit digital signal processing, my goal is that I can get the normal EEGdata. I can give you my raw data, please help to check, why it is no ok? for I can get the better data, I get up at 2 am to test the eeg, because the noise will be the least, but the data is still no ok.
This is a tutorial that Irene did some time ago,
https://irenevigueguix.wordpress.com/2016/07/06/eeglab-tutorial-import-data/
@wjcroft Channels 2, 4, 6, and 7 are railed when I playback at least two of the files above. The other channels look ok.
Thank you , let me try to filter the data, I hope you can give me more experiences and information, thank you so much.
I tried to filter the data,but I felt it still be no better, so I want to ask some problem: 1. when I filter the data, I choice the IIR butter worth for 0.45HZ -45HZ bandpass filter and the order is set 30, but the filter look like no good, like down picture:
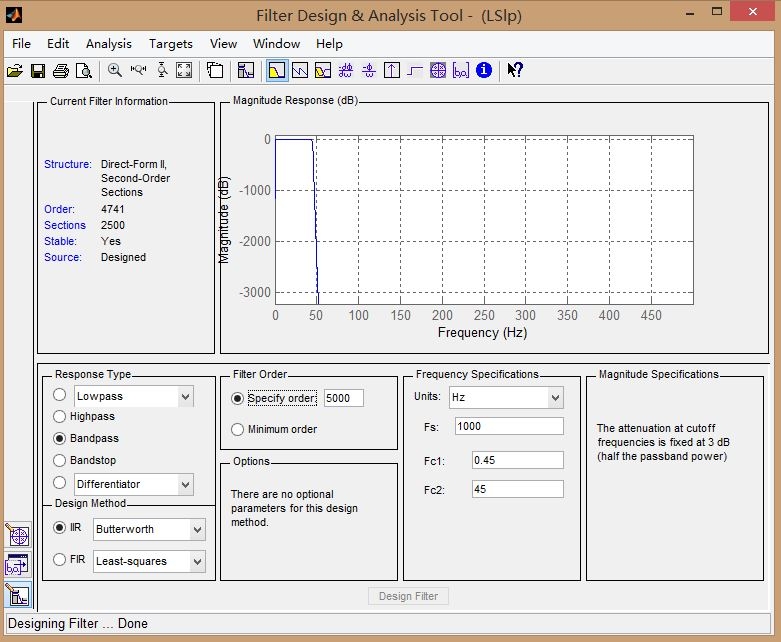
so I change the order to 5000, like this:
I fell it is very good, but the order is so high and I don't know it is correct or not, is there anybody here who can show me how to design the order of the butterworth filter?
2. which one kind of the filter is suitable for the 0.45-50 Hz bandpass filter and 0.45-150Hz banpass filter?
Generally the "filter order" does not need to be very high. I know that in neurofeedback applications, that order 4 is generally computed quickly and gives decent band edge sharpness. I'm not sure why your first graph looks so gradually tapered. And as far as the 2nd graph, filter order 5000 is simply never used; impractical.
Below is the output for a bandpass from .5 to 45 Hz, order 4, 1000Hz sample rate -- from Dr. Tony Fisher's 'mkfilter' page. Compare how sharp the band edges are to your first graph, order 30. This graph is only using order 4.
https://drive.google.com/file/d/1u4Jdq8VWUSp0BCtUrsXY9lcDiqXUoWY-/view?usp=sharing
https://www-users.cs.york.ac.uk/~fisher/mkfilter/
William
This page explains EEGLAB filtering,
https://sccn.ucsd.edu/wiki/I.4:_Preprocessing_Tools