
Neurofeedback. How to access the data in band power like the GUI.
 gerardkleelab
San Diego
gerardkleelab
San Diego
Hi,
I am trying to build a neurofeedback on alpha waves only to enhance meditation state. I have successfully streamed the data using LSL and can't really find pattern in the data. In theory, when I have my eyes closed, alpha waves should increase over time. The alpha band on GUI does exactly that, so I decided to access its data to start. I get the data and the data seems pretty random (please see attached pics below)
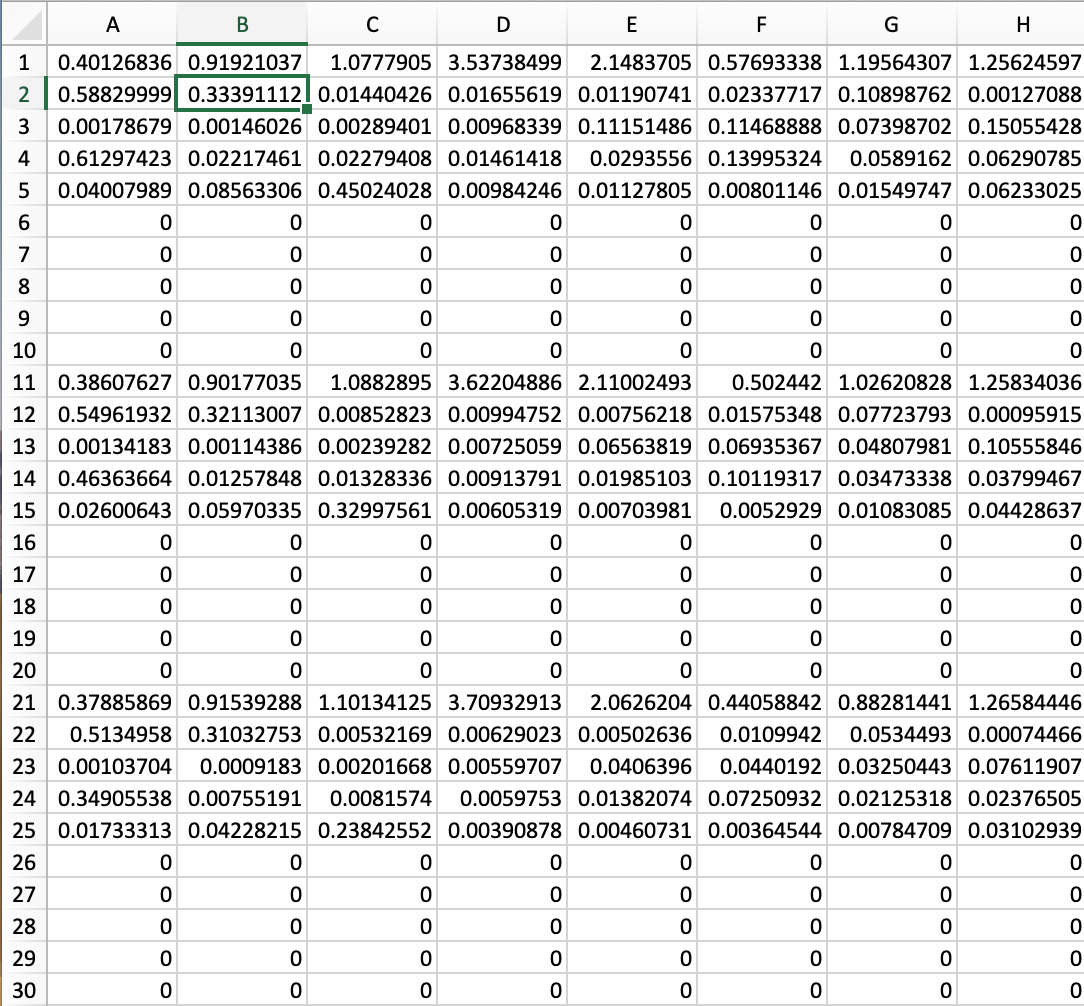

What I am interpreting is that the columns represent each channel and for this trial, I only hooked up first channel and second channel. And each row represent delta, theta, alpha, beta, and gamma. I am not sure why I am getting 0's in the data. Also, I am not sure why I am getting values from 3rd channel to 8th channel which are not connected to my head. Perhaps, I am not streaming the data properly. Below is my code to stream the data.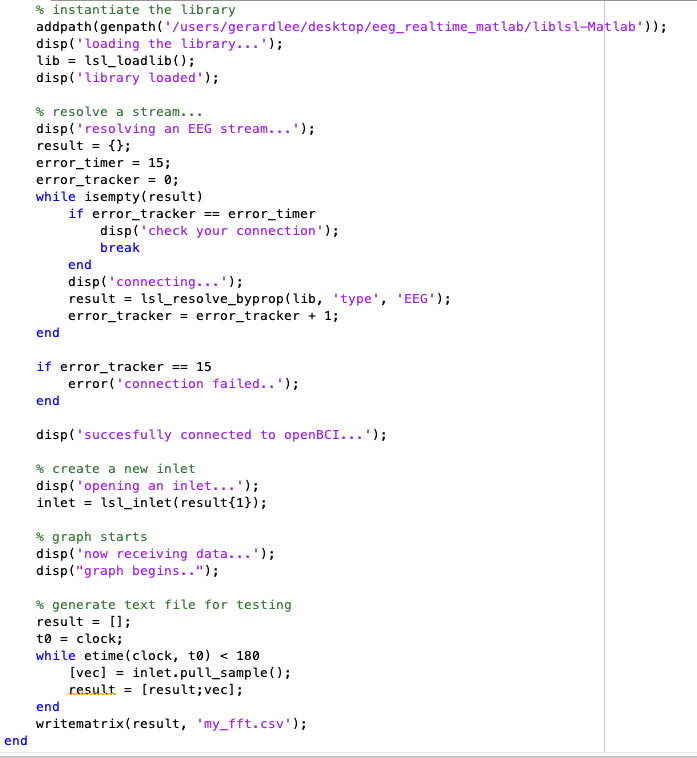
Would anyone advise me how to access the data in band power? I would greatly appreciate any help.
Comments
Is it possible that my electrodes are not functioning well? When I first got the device from one of my lab members, he said that it's been just sitting there for a while. The values look so random to me and I can't really understand what the values represent.
I guess I am doing something wrong. I was going through the forum and found this:
https://openbci.com/forum/index.php?p=/discussion/1390/detecting-eeg-frequency-bands
Here, Pete is doing exactly I would like to do, but it seems like he's doing it in javascript and I am using matlab. Is there any way that I can do something like this in matlab?
I cannot tell from the single page of date you posted whether you are getting raw signals or an fft transform of them. The alpha band is a bin or group of bins of an FFT transformation of the EEG signal data. Do you know what the units of your data are, and whether you are showing your data page as an FFT of the signal or the signal itself?
Have you got a copy of EEGLAB for matlab? See if you can use it to plot your data.
See also https://sccn.ucsd.edu/wiki/Chapter_10:_Working_with_ICA_components
@gerardkleelab For now, try putting 5 in the # chan textfield in the Networking Widget and refer to the Networking output guide which says:
Band Power
5 floats representing Delta, Theta, Alpha, Beta, Gamma band power for each channel in this exact order
https://docs.openbci.com/docs/06Software/01-OpenBCISoftware/GUIWidgets#lsl
This will all be fixed soon hopefully: https://github.com/OpenBCI/OpenBCI_GUI/issues/644. We are working to removing the Hub from the GUI at the moment.
This should get you started in the right direction. Hope this helps.
Thank you so much @retitut and @Billh! I will try doing your suggestions in matlab. I was going through this forum and found out that "eeg-pipes" library in javascript provides the function to study specific band power. I might as well try this.