
BDF Problem
 openoli73
germany
openoli73
germany
in OpenBCI_GUI
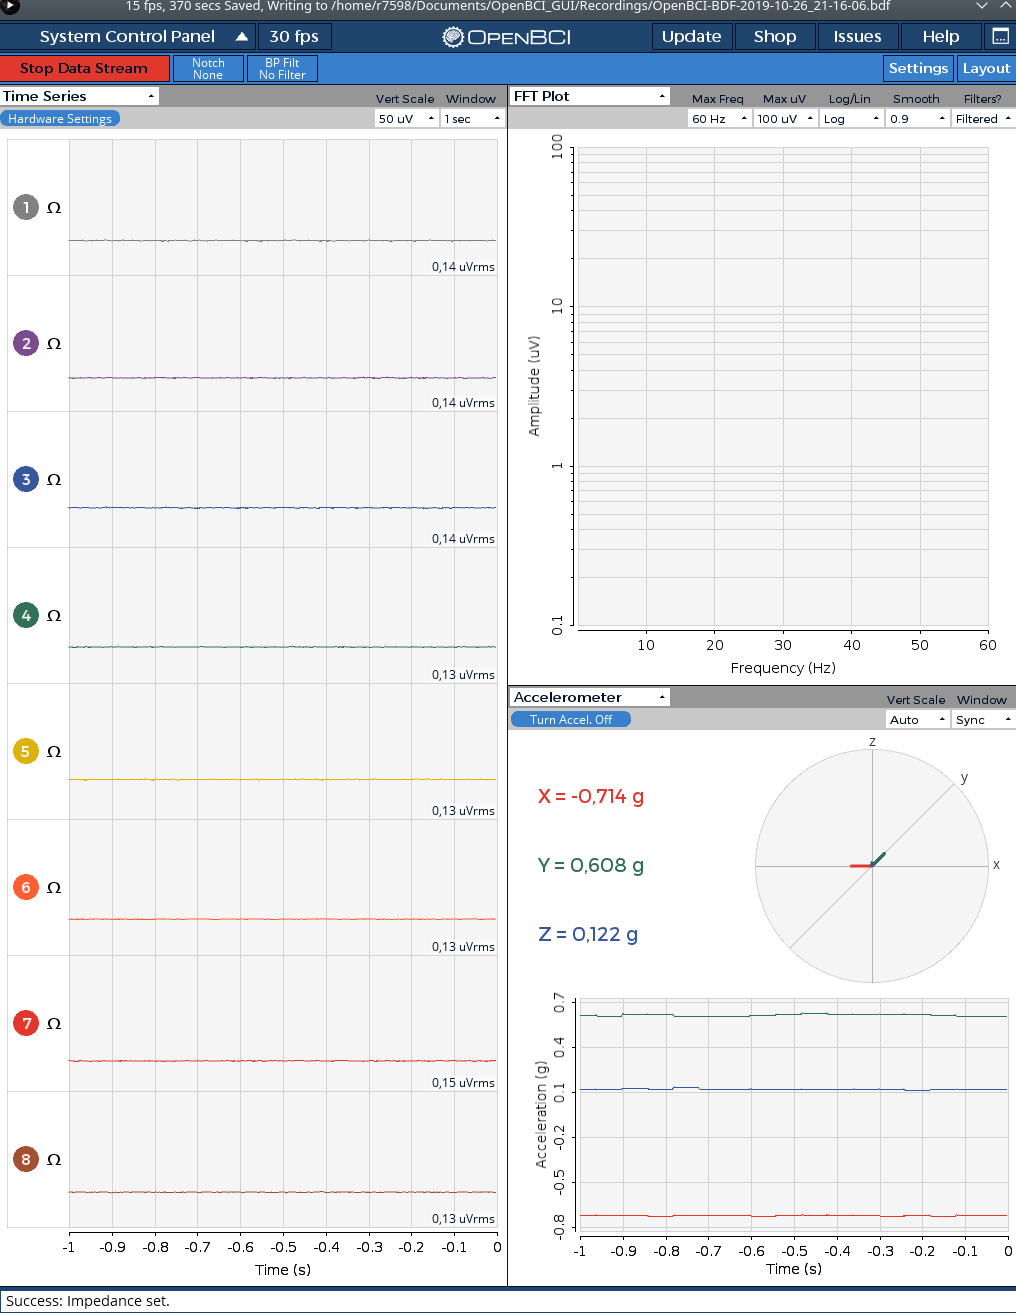
Hello, in the GUI the curves actually look normal. When viewing the data with the EDF-VIewer or VISBRAIN/SLEEP, very high levels appear. I already experimented with the filters. If you switch off all filters you will see one more level but no curve, probably because it is unbalanced. On the PC I also have an interference signal about every 5 seconds, which I don't have on the laptop. But I have the same problem with the BDF.


Comments
Thank you for providing pictures of both the GUI and the BDF files so we can do a comparison!
I have now applied a bandpass 1-45 Hz. Result as in the photo.
The data is saved without the GUI filters?
Now I have no more interference. I have switched off the WLANs.
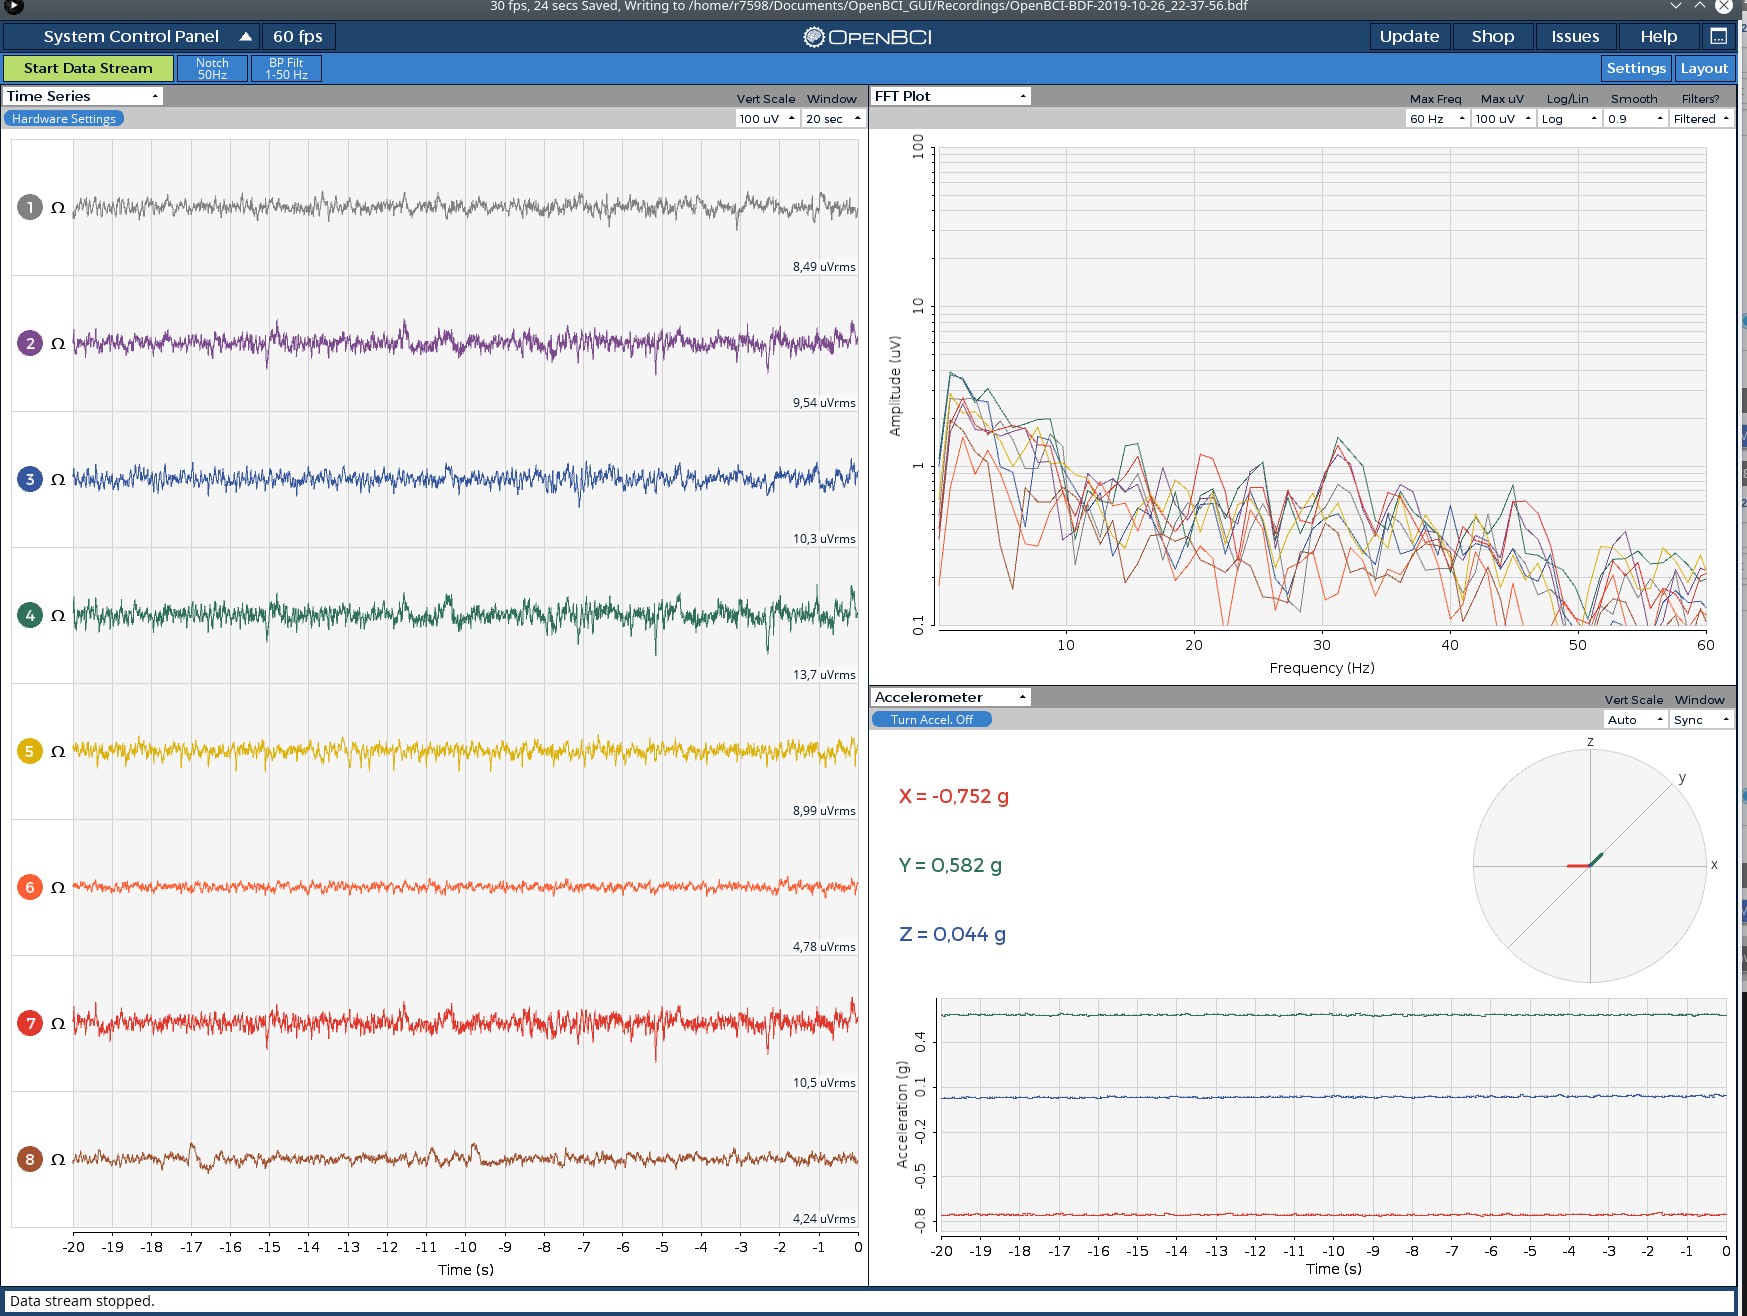
@openoli73 Thanks so much for sharing the screenshots! I can see the improvement also!
So this was interference caused by WiFi routers? Or did you turn off a laptop's WiFi adapter?
WIFI was on the laptop. I only switched off the routers. But the high values in the diagram (BDF) are still there.
Here's a screenshot of a BDF recording I just made. Uses Ganglion+WiFi @ 200Hz, no electrodes connected, and then I tapped the pins with my finger.
Okay, thanks. Are the hardware settings right?
Those are the default hardware settings. I would try adjusting an electrode before adjusting the gain.
After reviewing the GUI code and retesting BDF file generation, I'm pretty sure the Raw Data is saved to the BDF file. So, to make the data look like it does in the GUI, you will need to add Filters in the EDF Browser!
Okay, now it almost looks very good with Notch 50 and Band 5-45. Just these extreme rashes. Now I have WLAN again, but with a European instead of an American standard ;-). I will search even further. There seems to be no problem with the file or the recording.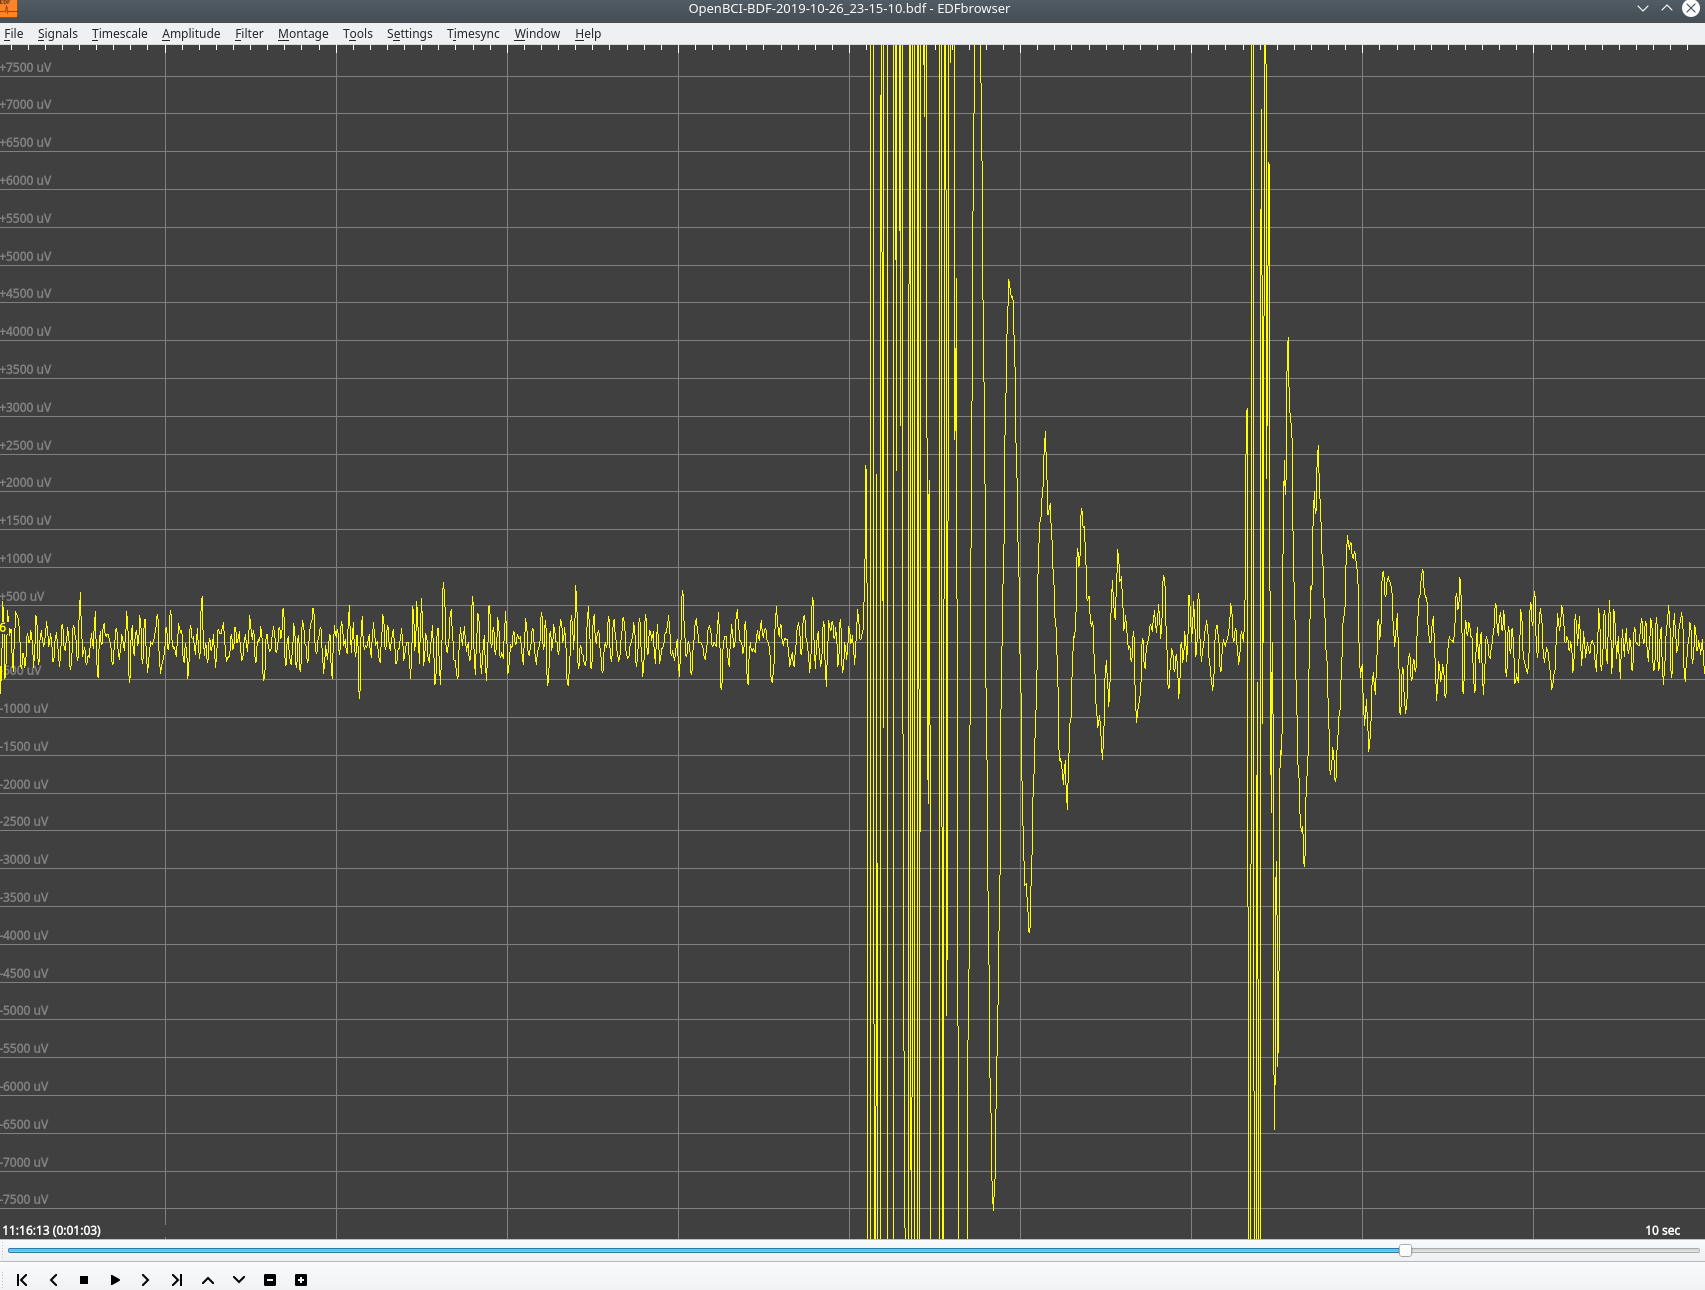
It's working. The last big values probably come from shutting down. They are only at the end of the recording. Super. Many thanks for the good support.")
One problem was the fan in the PC, which was always turning up every 5 seconds :-)
@openoli73 In the very first picture you shared, all of the channels show ~0.14uVrms, and I have seen this before where the board gets "stuck". To fix this, try turning off the board and dongle, and then re-connect.
Other than that, any board changes, such as turning a channel on/off, may produce a small spike if the data is streaming. To reduce this, just make changes while the data is not streaming.
Glad to hear everything is working out! These tips should also help.
Thank you for pointing that out. @retiutut
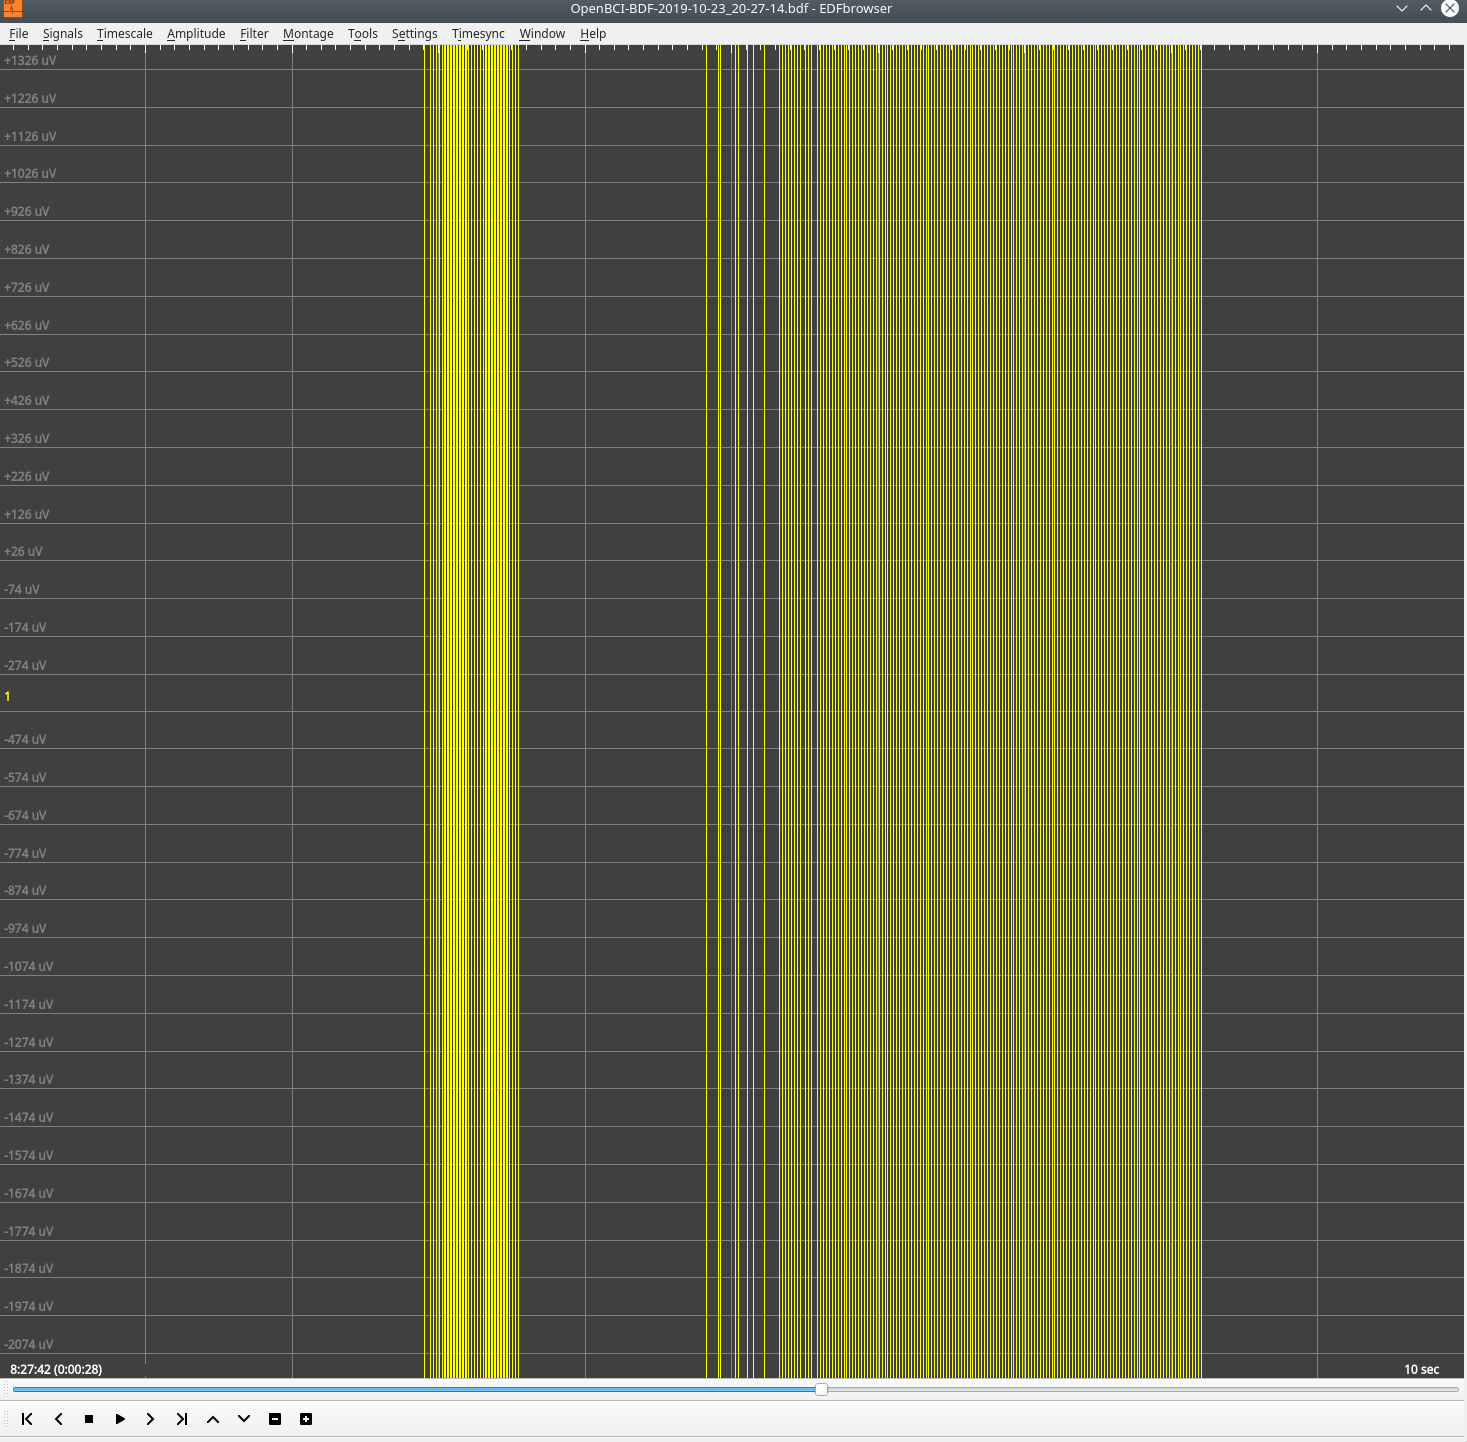
What I don't understand is that when I turn off the BP filters there should still be a signal visible in the TS. But why is it empty? At 10000µV you sometimes see a line, but you don't see an answer to eye movements or anything else. Or is my hardware still disturbed?
Furthermore, BrainBay shows very high values in theEEG module of


-187500/187500 µV on. Is that correct? But it works very irritatingly. I also saw these values in the EDP browser with data from the GUI.
The high values are normal for the input range of the ADS1299. That no curve is displayed without filter is also normal. It is due to the phase position.
I found the main problem now. I had soldered some wires to the board and plugged some. The board is very tight and diagonal in a small case. The contacts have connected a bit. Partly also with the upper row of the contacts. This caused the extreme deflections. I have now recorded a signal without EEG and filtered it with a BP 1-30 quality 6 and see there - finally everything looks very nice (see EDFBrowser). Finally the recording of sleep with apneas and arousal comes closer.

The connections weren't the problem. Can I check the firmware version to see if it is up to date?
@retiutut Can you send me a sample photo with electrodes on my head? Maybe I also destroyed the ADS1299 statically or thermally?
Can you send me a sample photo with electrodes on my head? Maybe I also destroyed the ADS1299 statically or thermally? I have just read the data sheet.
But why don't I see the strong waves in the GUI? Everything looks normal there.
I have now done a test with EDFbrowser. I also get an error message about the data in visbrain.
BDF file detected
Setting channel info structure...
Creating raw.info structure...
Reading 0 ... 5749 = 0.000 ... 22.996 secs...
Data successfully loaded (/home/r7598/Documents/OpenBCI_GUI/Recordings/OpenBCI-BDF-2019-10-31_17-34-45.bdf):
/usr/local/lib/python3.7/dist-packages/visbrain/io/read_sleep.py:213: UserWarning: Wrong channel data amplitude.
warn("Wrong channel data amplitude. ")
/usr/local/lib/python3.7/dist-packages/scipy/signal/spectral.py:1969: UserWarning: nperseg = 3750 is greater than input length = 2875, using nperseg = 2875
.format(nperseg, input_length))
File already dowloaded (/root/visbrain_data/topo/eegref.npz).
File already dowloaded (/root/visbrain_data/topo/eegref.npz).
I would like to continue working? Where is @Retiutut? When will he be back?
Can someone send me a bdf+ file from Cyton or attach it here? Thank you
If only someone could explain to me how the extremely strong deflections can get into the file. I would have to see them in the GUI too or is there a normalizer built in?
Okay, in amplitude, it can only be muscle artifacts. I now have the headband slightly higher. It seems to work with a bandpass of 3-30.