EEG data analysis, delta band strongest

fnngnfnngn china
edited May 2025 in Research

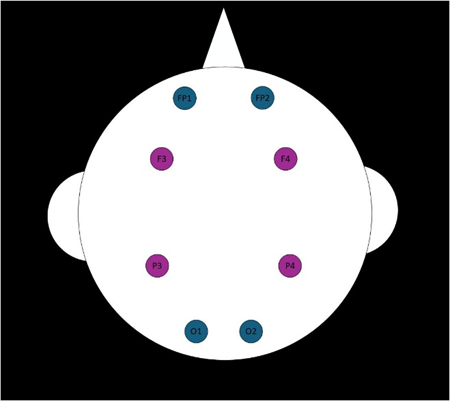
Hello, when analyzing EEG data, I want to observe the PSD power distribution of 5 frequency bands(Delta,Theta,Alpha,Beta,Gamma). The 8-channel electrode positions used are shown in the figure below.
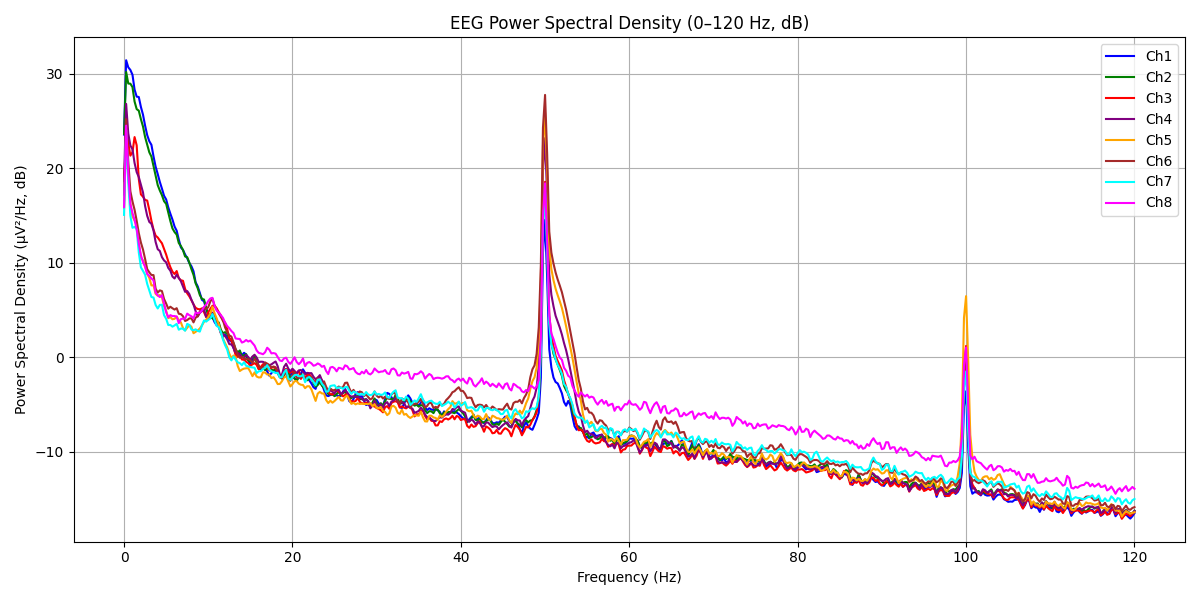
The PSD distribution of the original data is shown in the figure.The psd power of delta is two orders of magnitude higher than that of other frequency bands! ! ?
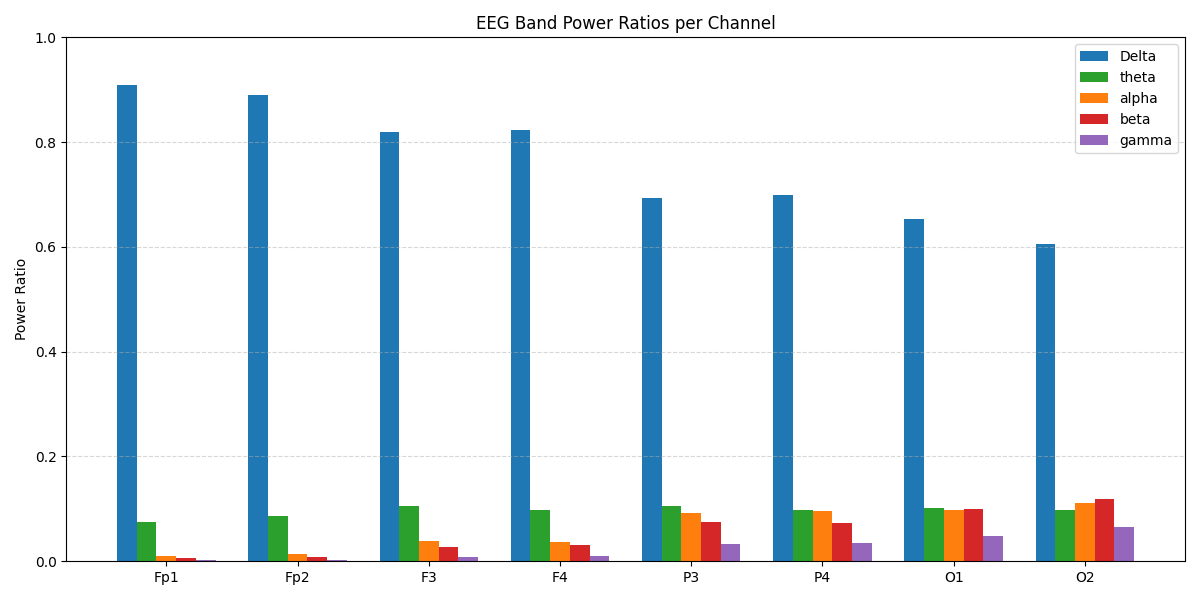
Secondly, when I remove the EOG signal using detrending, a 4th order Butterworth filter (0.5 Hz to 45 Hz), a 50 Hz notch filter, and ICA, the low frequency energy is slightly reduced, but still high. Am I missing some processing step?
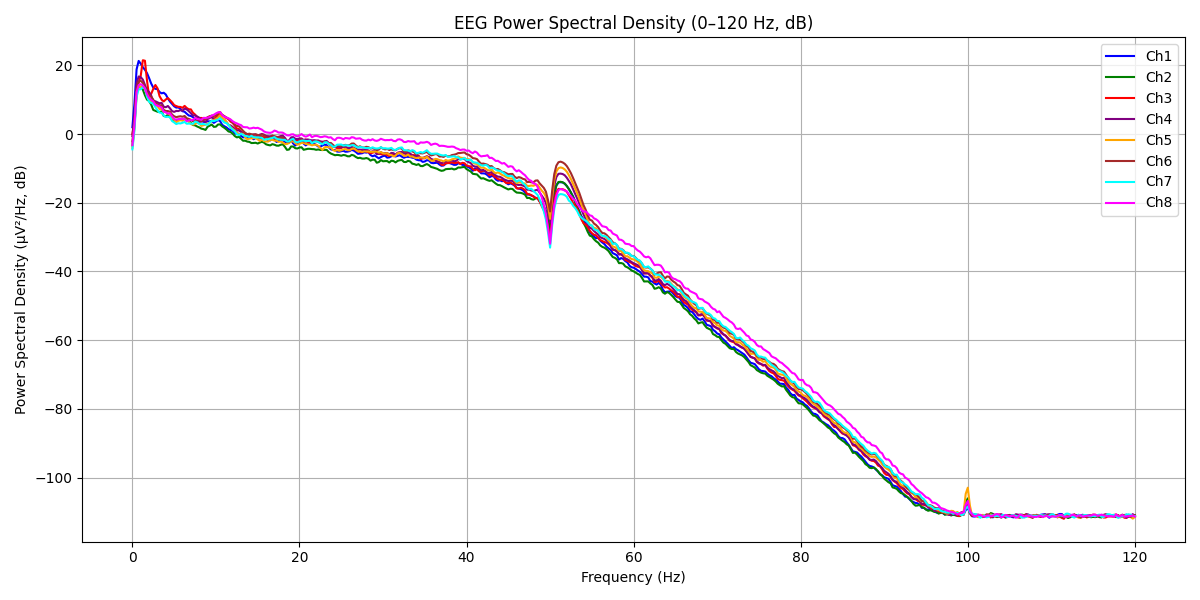
I need to use the EEG signal for fatigue detection, and I cannot filter out the delta and theta bands because the energy of the delta and theta bands may increase when I am tired. But now the energy at the low frequencies is so high that it is difficult for me to analyze.
Can you tell me if this is normal? Is there something wrong with my process steps?

Comments

  • wjcroftwjcroft Mount Shasta, CA

    Hi Fnngn,

    This is normal. Read some of the search results below.

    https://www.google.com/search?q=eeg+1/f+power+law

    AI Overview
    The "1/f power law" or "1/f-like" power spectrum refers to a ubiquitous feature in EEG (electroencephalogram) data, where the power of the signal decreases proportionally to the inverse of frequency. This characteristic shape is often described by a power law function, S(f) = c/f^α, where S(f) is the power spectral density, f is the frequency, and α is the exponent determining the steepness of the decay. The slope of this decay, often referred to as the "1/f slope", can provide insights into the brain's activity and states.
    Elaboration:
    Ubiquity:
    The 1/f power law is observed in various physical systems, including the brain, where it represents the aperiodic, or non-oscillatory, background activity.
    Power Spectral Density (PSD):
    The 1/f power law manifests in the power spectral density (PSD) of EEG signals, where the power decreases as frequency increases.
    1/f Slope:
    The steepness of the 1/f power law decay is quantified by the exponent α in the power law equation. A steeper slope (larger α) suggests a dominance of inhibitory activity, while a flatter slope (smaller α) indicates a balance or dominance of excitatory activity.
    Functional Relevance:
    While initially considered noise, 1/f activity has been recognized as potentially functionally relevant. Changes in the 1/f slope have been linked to cognitive tasks, aging, and brain states.
    Examples:
    Studies have shown that 1/f activity changes with age, cognitive load, and between different behavioral states. For instance, older adults may exhibit a flatter 1/f spectrum compared to younger adults.
    Baseline Correction:
    Proper baseline correction is crucial when analyzing EEG data, as 1/f activity can be misconstrued as a signal of interest if not properly accounted for.
    Decibel Conversion:
    Conversion to decibels (dB) can distort the data if 1/f activity is not considered, potentially leading to misinterpretation of interactions between groups with different levels of broadband activity.
    Models and Theories:
    Various models and theories attempt to explain the origin of 1/f activity, including those based on stochastic excitatory and inhibitory currents and the role of noise in neural dynamics.

    Regards, William

Sign In or Register to comment.