
Brainwave data visualization / safety helmet
 NinjaPotato
Bologna, Italy
NinjaPotato
Bologna, Italy
Hi everyone. I'm new here, and in general I'm quite new to EEG and its applications. I'm doing my product design bachelor's thesis on designing a comfortable and slim headband which could be integrated under a safety helmet for monitoring high risk workers attention.

I'm experimenting with the OpenBCI Cyton, tried their standard electrode caps and now I've tried to make a headband with textile sensors (using this conductive fabric). I've managed the basic eye blink signal, then I coupled the "fabric sensors" with an occipital dry comb electrode, from which I got the closed eye alpha rhythm (the 10 Hz peak).
Now I'm trying to actually "visualize" in an intuitive way the result I got from the OpenBCI GUI software. What I had in mind was to clearly show the closed eye alpha 10 Hz peak in a graphic manner, like a small circle (representing the 10 Hz) pulsing inside of a bigger one (the rest of the frequencies), so to clearly convey the concept to people that never heard about EEG when I'll eventually present the thesis.
One idea was to use rawgraphs.io to import the OpenBCI gui raw data. But I don't really have a clue on which parameters to use.
Searching "EEG data visualization" I've found some amazing concepts, and works. Especially the ones that visualizes the brain activity of a subject listening to music. How do they manage to translate brain activity into that sort of visualization? Does anyone know if there are some pre-made softwares or some code that I could use with my own experimental headband connected to the Cyton?
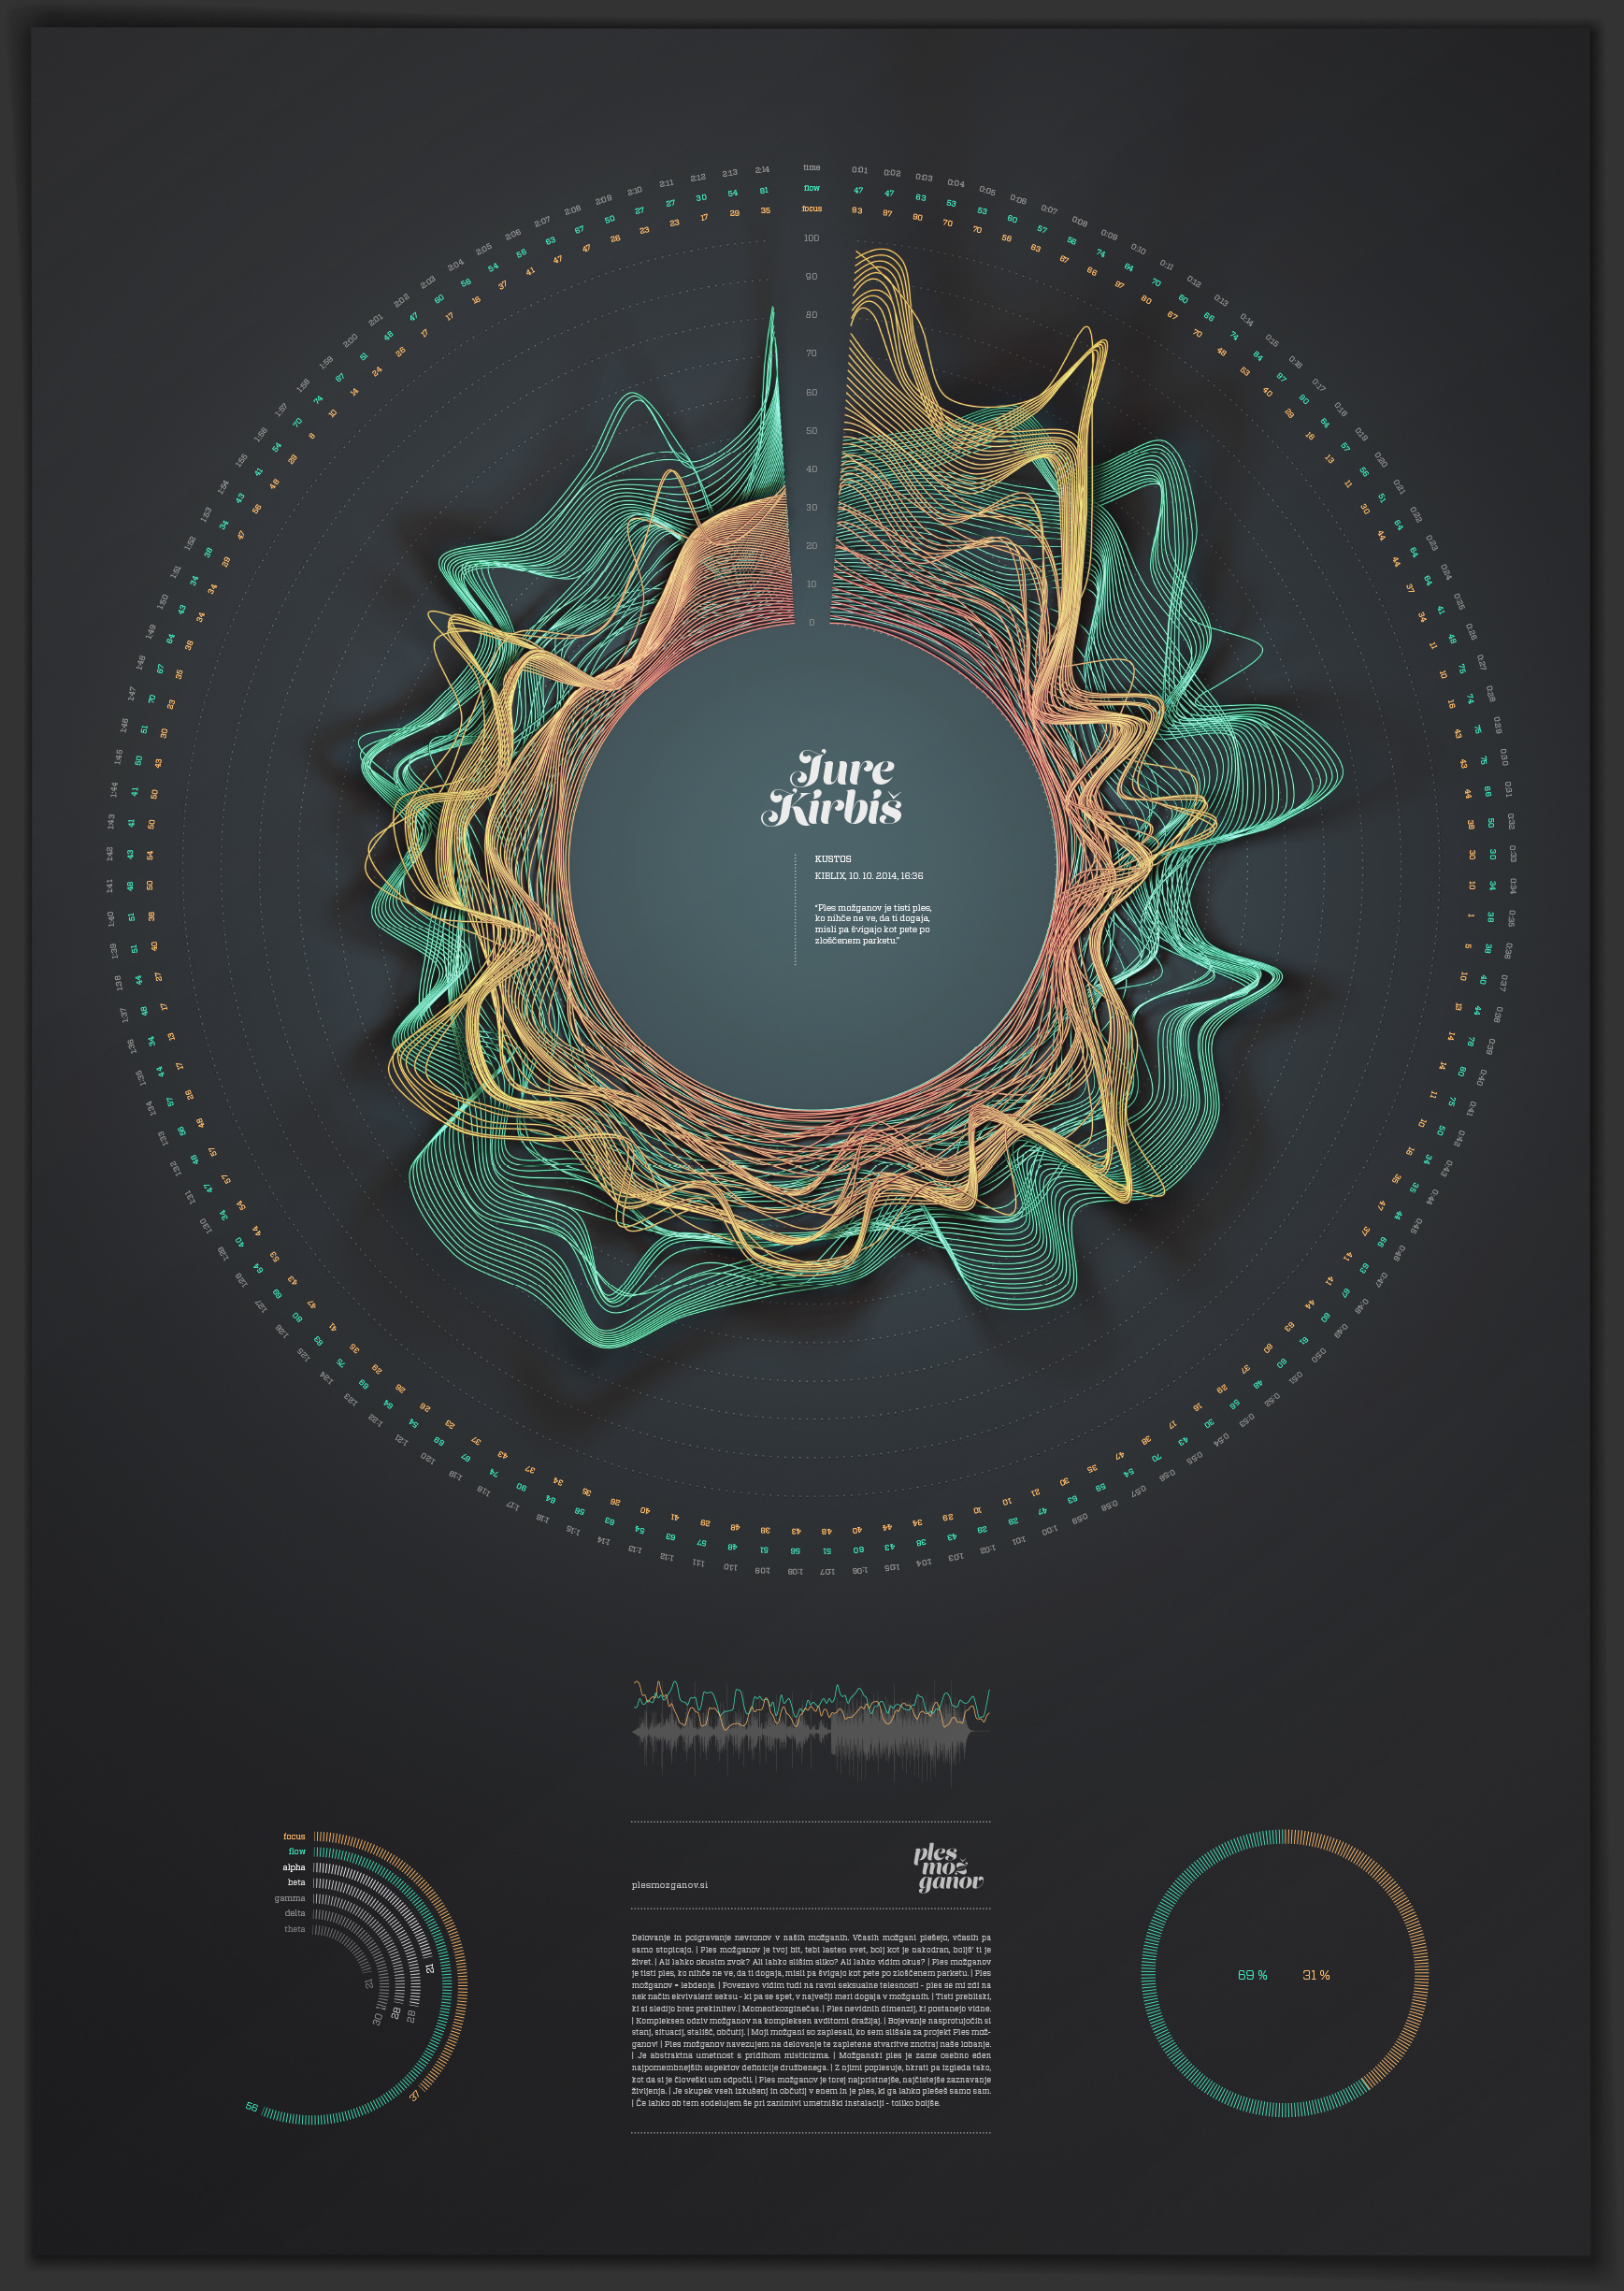
Just found out brainwave visualizer from neurosky and the visual is exactly what I'm looking for as what I'd like to achieve, but of course it's just compatible with neurosky devices. Are there other softwares out there that do a similar thing which are compatible with the OpenBCI cyton?
Thanks so much for the help if anyone reads this. 
Comments
Hi Ninja,
Actually there are many VPL (Visual Programming Language) apps that can accept OpenBCI data streams. Below is a post from 2015 on the VVVV app. This app can accept OSC (Open Sound Control) data streams, and create visualizations. The OpenBCI GUI can output the EEG data as an OSC stream.
https://openbci.com/forum/index.php?p=/discussion/comment/1680/#Comment_1680
[Ignore the info on the above post regarding the OpenBCI_Python repository, it has been replaced by Brainflow, see further below. OpenBCI_GUI can directly output OSC format streams, no transformations needed.]
Also remember that you can write your own Python (or other languages) code to do whatever visualization you desire. Using the Brainflow library to access the live data stream.
https://brainflow.readthedocs.io/en/stable/Examples.html#python-real-time-plot
Other VPL apps that can accept OpenBCI data streams include: neuromore, BrainBay, OpenViBE, BioEra, etc.
https://docs.openbci.com/Software/CompatibleThirdPartySoftware/Neuromore/
Regards, William
Also see this related project from 2015,
https://openbci.com/community/wakecap-obci-based-device-for-drowsiness-detection/
I believe the WakeCap app delivered the "drowsy warning" via auditory means, which is more practical than visual feedback for many reasons. (The subject using the cap can be doing a task such as driving or construction, without being distracted with a computer screen.)