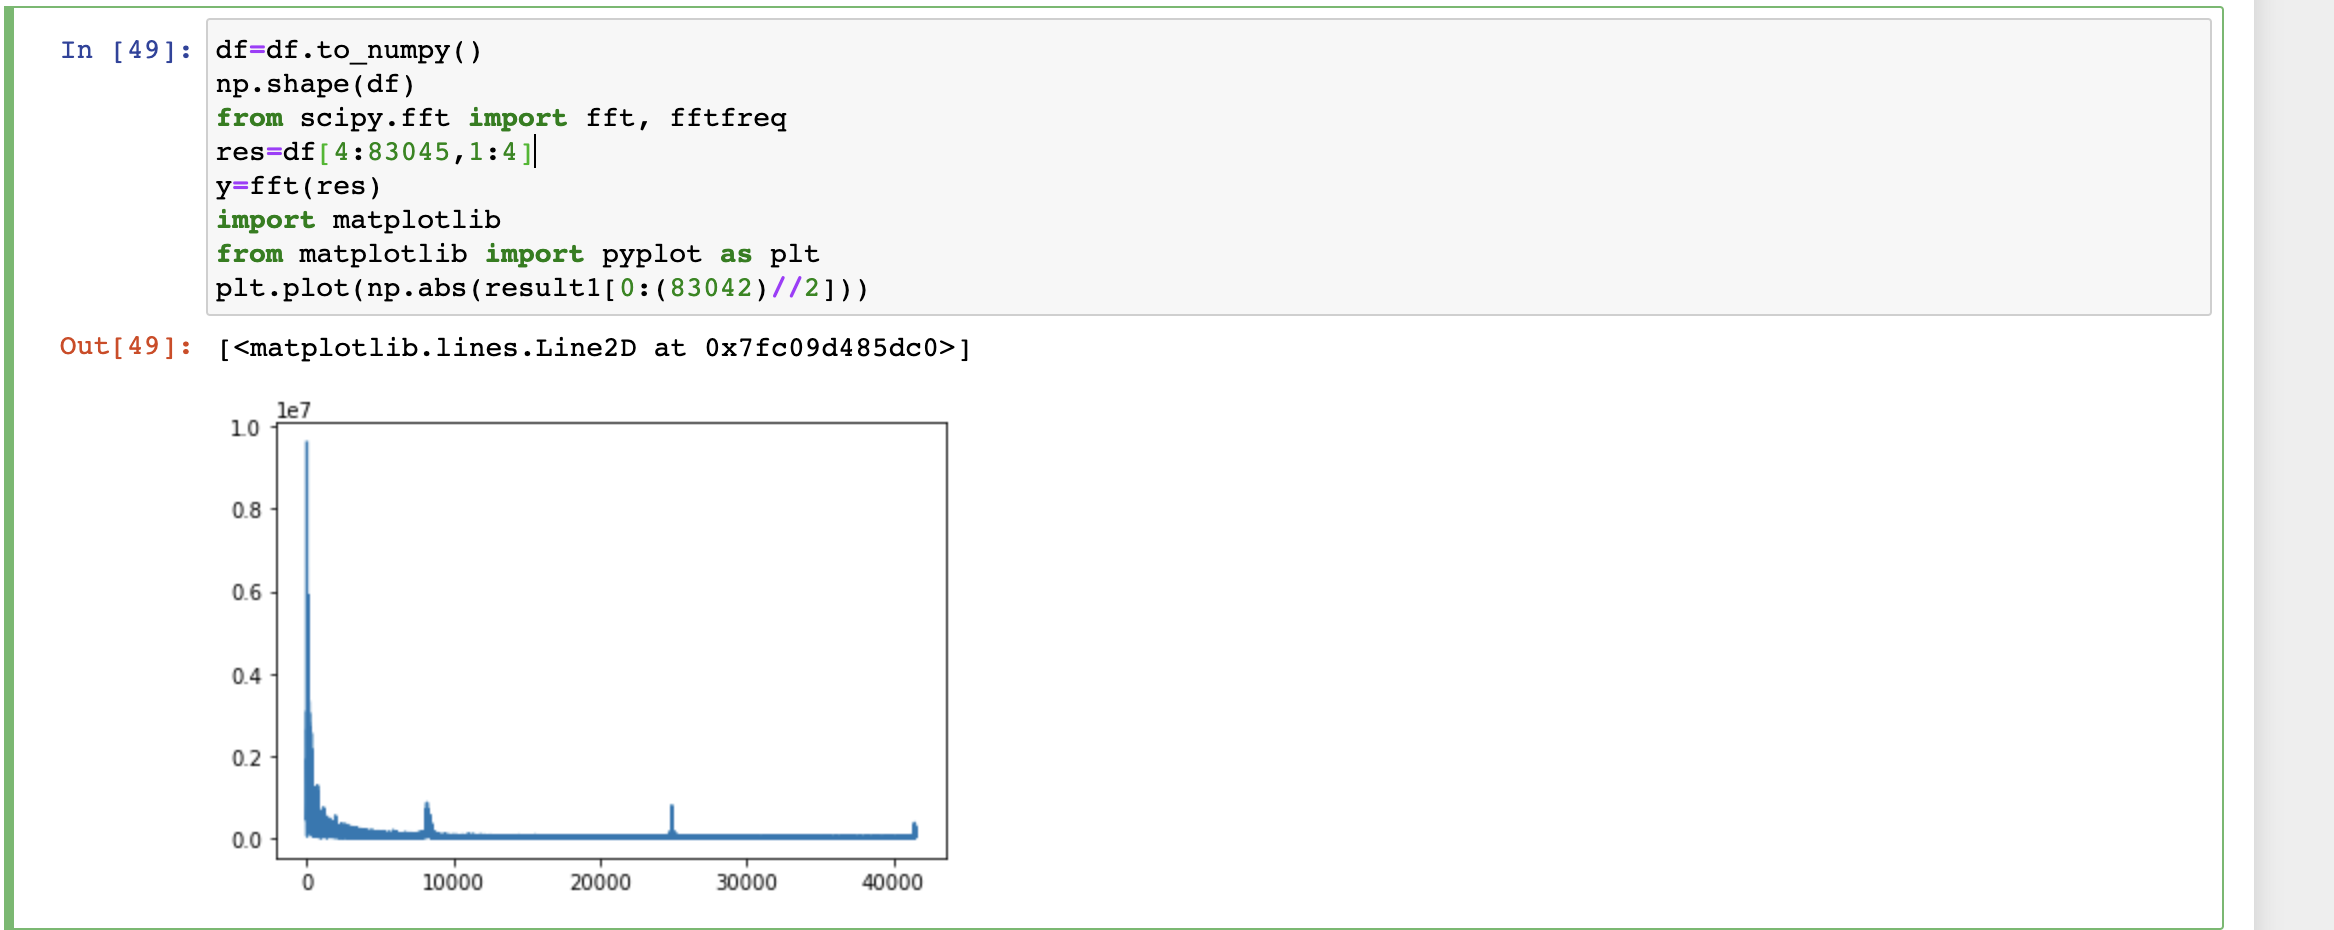
Getting weird frequency values after Fourier Transform

I'm trying to extract frequency values from raw openbci eeg data from acquired from the ganglion board using the Fourier transform. However, the values I've gotten don't make sense. As you can see from the plot, I'm getting values greater than 10,000 hz, although I expected to see low frequency bands in the theta (4-8 hz) and alpha ranges (8-12 hz). Looking at the code, how did I mess up?