This article introduces the development of the focus algorithm used in Focus Visualization Widget, it is almost the same as that used in Dark Maze.

Overview:
- Designing experiments to collect data
- Recording EEG data and time of events
- Making assumptions before designing algorithm
- Calculating the proposed alpha and beta features
- Building and testing the algorithm in Excel
- Using the focus event in other programs
- Futher thoughts
1. Designing experiments to collect data
The task Jordan performed was to stare at a banana for a period of time then, try to lose focus for another period.
2. Recording EEG data and time of events
EEG data was recorded with OpenBCI GUI, and at the same time we recorded screen with audio input by QuickTime, so the time when he started and lost focus was annotated by voice. It is said that frontal lobe is related to cognitive process so we were only looking at channel 1 and 2 (Fp1 and Fp2 in 10-20 system).
3. Making assumptions before designing algorithm
Suggested by Conor that focus is related to alpha and beta band, which are some frequency components of EEG, I started by looking at the FFT Plot.
FFT stands for Fast Fourier Transform. Fourier Transform is a mathematical method to decompose any periodic data into different “frequency components”. Fast Fourier Transform is the fast and discrete version of Fourier Transform, so the resulting frequency components are segments of frequency bands named FFT bins. The FFT plot in OpenBCI GUI is the FFT amplitude map, of each data point the y value stands for the amplitude of this frequency bin, and the x value stands for the center frequency of this frequency bin.
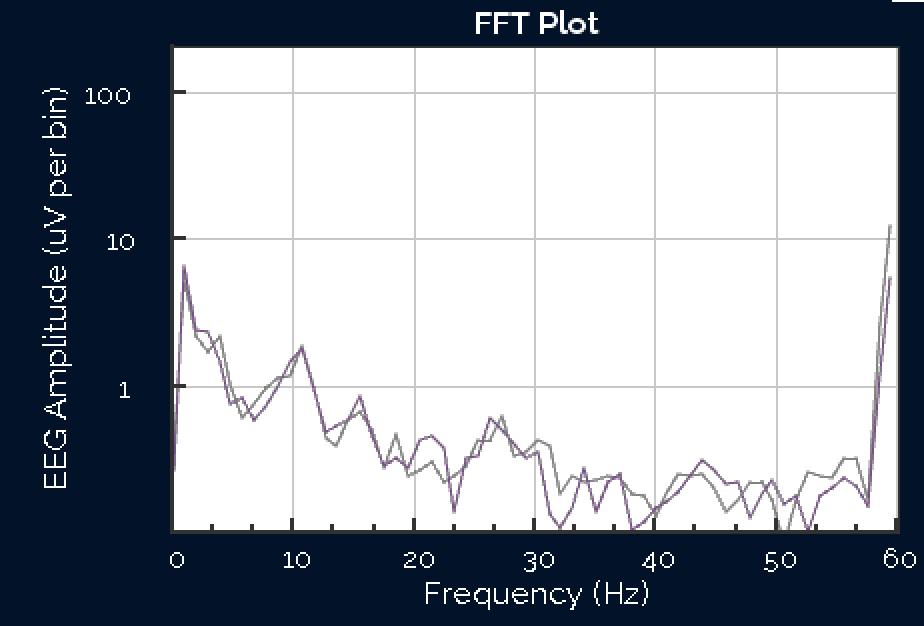
In a FFT plot, alpha band can be defined as frequency components between 7.5 – 12 Hz, and beta band defined as frequency components between 12.5 – 30 Hz. Following this definition, I observed this pattern of high alpha amplitudes and low beta amplitudes compared to an unfocused state.
Typical FFT plot during focused state:
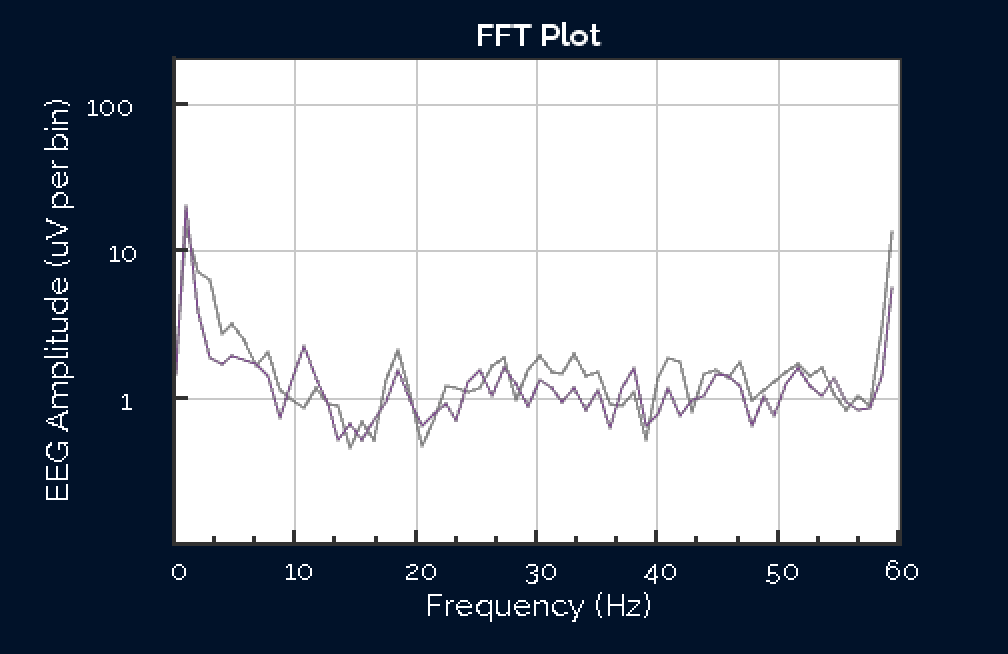
Typical FFT plot during unfocused state:
4. Calculating the proposed alpha and beta features
In order to calculate the alpha and beta levels, FFT amplitude values was needed, and they can be retrieved inside EEG_Processing.pde (DataProcessing_User.pde if you are using OpenBCI GUI v2.0).
Then I began to calculate averaged alpha and beta amplitudes as a representation of alpha and beta band power. They are defined as averaged FFT bin amplitudes in alpha or beta band:
alpha_avg = {average(FFT_value_uV) | FFT_freq_Hz in [7.5,12.5] }
beta_avg = {average(FFT_value_uV) | (FFT_freq_Hz in (12.5, 30] }
Below is the edited Processing code about FFT in EEG_Processing.pde
float FFT_freq_Hz, FFT_value_uV;
int alpha_count = 0, beta_count = 0;

for (int Ichan=0; Ichan < 2; Ichan++) {  // only consider first two channels
  for (int Ibin=0; Ibin < fftBuff[Ichan].specSize(); Ibin++) {
     FFT_freq_Hz = fftBuff[Ichan].indexToFreq(Ibin);
     FFT_value_uV = fftBuff[Ichan].getBand(Ibin);

     if (FFT_freq_Hz >= 7.5 && FFT_freq_Hz <= 12.5) { //FFT bins in alpha range
         alpha_avg += FFT_value_uV;
         alpha_count ++;
     } else if (FFT_freq_Hz > 12.5 && FFT_freq_Hz <= 30) {
         beta_avg += FFT_value_uV;
         beta_count ++;
     }
  }
}

alpha_avg = alpha_avg / alpha_count;  // average uV per bin
beta_avg = beta_avg / beta_count;  // average uV per bin
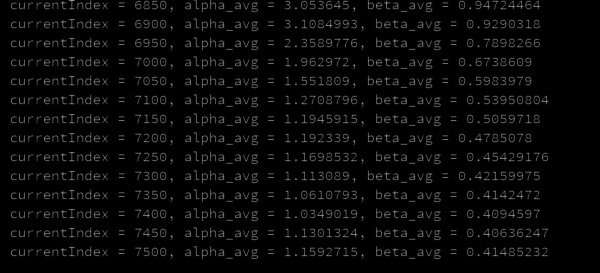
Below is the printed values of alpha_avg and beta_avg. (Notice Index = 7100 is the time when jordan began to start focus)
5. Building and testing the algorithm in Excel
Next, to build an algorithm that can separate focused state from unfocused state, I exported the alpha_avg, beta_avg over time to an Excel spreadsheet and visualized it with diagrams (inspired by Mathura).

By experimenting with different combination of alpha and beta thresholds, I finally came up with an experiential equation that expressed the assumption of “high in alpha and low in beta”, with an additional upper threshold of 4uV for noise handling:
Focus == (alpha_average > 0.7uV ) && (beta_average < 0.4uV) && (alpha_average) < 4uV.
After experimenting on multiple people other than Jordan, the threshold of beta was changed from( < 0.4uV) to (< 0.7uV) so it is less critical.
Later in the spring show it was further changed to:
Focus == (alpha_average > 1.0uV) && (beta_average < 1.0 uV) && (alpha_average < 4 uV)
and it worked well on around 20 testees from young to old when they started to calm down and focus.
Below is a sample Processing code of focus detection:
if (alpha_avg > 0.7 && alpha_avg < 4 && beta_avg < 0.7) {
  isFocused = true;
} else {
  isFocused = false;
}
6. Using the focus event in other programs
To enable this feature in Focus Visualization Widget, change the enable_keystroke value to true so it will automatically trigger a space key stroke when a person is focused. (Beware it could damage your source code by adding unwanted spaces)
In order to send focus events to our Unity game in Dark Maze project, I used the “simulate key stroke” trick learned from another class Digital Fabrication for Arcade Cabinet Design. This “simulate key stroke” feature is provided by Java Robot, and we can use it because Processing is based on Java. So basically whenever there is an event detected, Processing will send a keyPress() or keyRelease() event of either spacebar or arrow keys to play the Unity game. Since it is literally the same as playing the game with keyboard, we don’t need to add anything in Unity.
Below is the simulating key stroke code in Processing.
Before setup():
import java.awt.AWTException;
import java.awt.Robot;
import java.awt.event.KeyEvent;
Robot robot;
In setup():
try {
  robot = new Robot();
} catch (AWTException e) {
  e.printStackTrace();
  exit();
}
In draw():
if (isFocused) {
  robot.keyPress(KeyEvent.VK_UP);
}
else {
  robot.keyRelease(KeyEvent.VK_UP);
}
(Beware it could damage your source code by adding unwanted spaces)
7. Futher thoughts
Although it seemed working well with most of the testees before, I still need to collect more data to test the accuracy of this algorithm.
And I’m yet not clear if that’s legitimate to average amplitudes in the map. Instead of averaged amplitudes, it makes more sense if I just calculate the alpha energy and beta energy via power spectrum density, since only energies make sense to be summed up. If there is only one frequency source in each of alpha band and beta band, it also makes more sense to use the peak amplitudes instead of averaging them, although it could be also bad for noise handling. Also sampling rate and FFT length should be taken into consideration since they could influence the frequency resolution, thus smoothing the result and lowering the amplitude peaks. These are the questions that need to be settled in future research.
Leave a Reply
You must be logged in to post a comment.