Way back in September, I was with the OpenBCI folks at Maker Faire NYC showing off our very first OpenBCI prototype. I was there wearing my bright blue EEG cap doing live demos of my brain waves. It was fun. On day 2, however, there was a guy who came up and demanded (politely) that he wear the EEG cap. Given how long it takes to setup the cap correctly (with all the EEG gel and whatnot), I tried to decline his request. But he persisted. He told me that he was a meditator and that he needed to know if anything was actually happening in his brain when he was meditating. Wow, you got me hooked me. Let’s do it!
Non-Meditating: First, just so we all recognize what a normal, messy EEG recording looks like, check out the graphs below. These are spectrograms of EEG signals recorded from my head using OpenBCI V1 and an EEG cap with tin electrodes. The top plot is from the front of my head (Fp1-Fz) and the bottom plot is from the back-left area of my head (I think that its actually T5-Fz). Note that both signals are highly corrupted by low-frequency artifacts from blinking my eyes. Otherwise note that, when my eyes are closed, I show a nice signal ~10 Hz in the back of my head. This is the classic posterior dominant rhythm that occurs in the Alpha band. Notice that, besides the alpha and besides the eye blink, there is not much structure anywhere else in plots…it mostly just looks like messy noise. Fine.
 |
| My EEG With My Eyes Open and Closed (No Meditating). The arrows point to alpha waves that are commonly seen when one’s eyes are closed. |
Meditating: So, now we turn to the data from my meditating friend. The spectrograms below show data that we recorded from him using the same OpenBCI board and the same blue EEG cap. In these plots, my friend was already meditating by the time I started to record the data. So, to the left of the vertical line, this is data when his eyes were closed and he was meditating. To the right of the line, he was not meditating and his eyes were open and closed at various times. I find this data to be quite impressive. Notice that there is clearly a band of signal energy between 15-20 Hz while he is meditating. In the second half of the data, where his eyes are closed, there is maybe some of that 15-20 Hz signal, but it isn’t nearly as strong as during the meditation. I think that it is very cool that we appear to be seeing a physical (well, electrical) effect in his brain due to meditation. Additionally, note also that he shows no alpha waves (nothing around 10 Hz) when his eyes are closed. Is the meditation suppressing his posterior dominant rhythm, or does he just not exhibit one? I don’t know, but it’s cool.
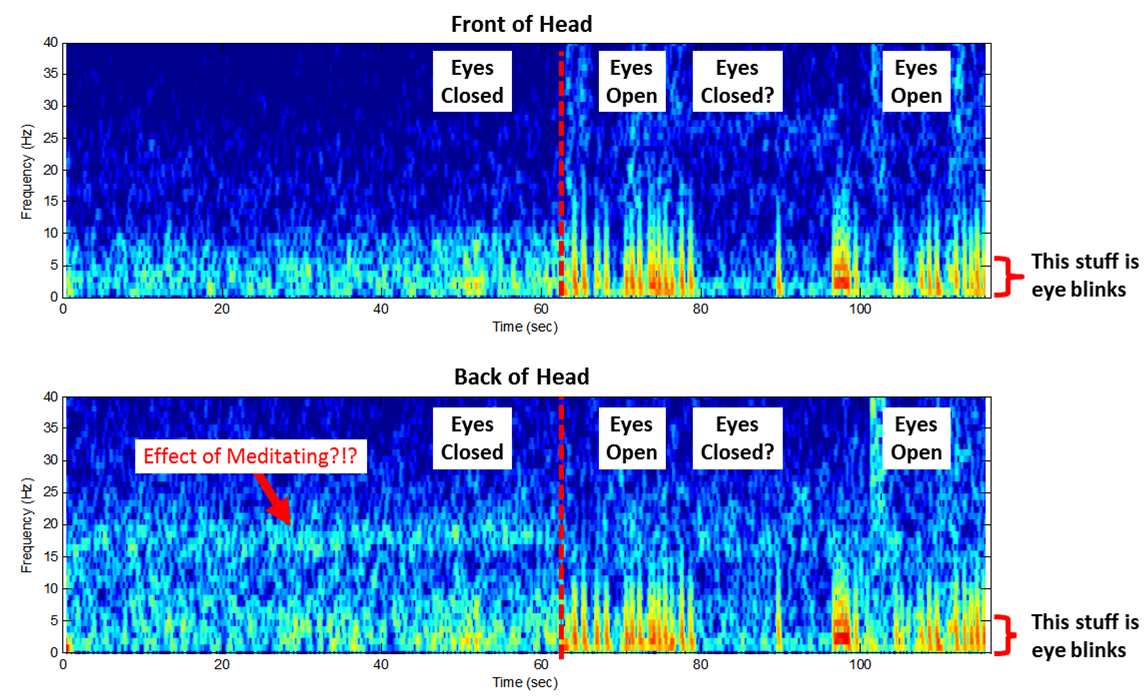 |
| EEG recorded from a meditator. Left of the line, he is meditating. Right of the line, he is not. Notice the signal energy between 15-20 Hz (and the absence of alpha waves) when he is meditating. |
What Does It All Mean? I make no claims regarding meditation being good or bad. I make no claims regarding EEG signal energy in the 15-20 Hz band being good or bad. All I know is that we can measure changes in his brain waves and that they appear to be due to him meditating. That’s really cool to me.
More Learning: Via email, I showed this data to with my meditating friend. He sent me back an outstanding link that was a survey of different schools of meditation and their relationship to changes in measured EEG. If you’re into that kind of thing, it makes for fascinating reading:
Travis, F., & Shear, J. “Focused attention, open monitoring and automatic self-transcending: Categories to organize meditations from Vedic, Buddhist and Chinese traditions.” Consciousness and Cognition (2010)
http://www.koepnick.de/Three%20Typs%20of%20Meditation.pdf
Have any of you recorded your brain waves while meditating? What did you find? Let me know!
Follow-Up: I recorded another meditator. Check out his data here!