It turns out that my previous post on EEG and meditation was surprisingly popular. The post even got one of my friends interested enough that he, too, wanted to see what happened to his EEG signals while he was meditating. So, we hooked him up to one of my OpenBCI boards and took some measurements! Here’s the story of what we found together.
 |
| My second willing meditator. (And the blue cap returns!) |
Goal: My goal with these recordings is simply to see if meditation has a measurable effect (any effect) on one’s EEG signals. I’m trying understand if a particular form of mental activity (ie, meditation) can be measured objectively.
Setup: For this set of recordings, we decided to go the Full Monty and bring out the blue EEG cap (see photo above). This was the same cap as used with the previous meditator. We got the cap as part of a kit that we bought from Biopac. Our cap has lots of electrodes. We chose to use the eight electrode locations shown below. Our reference electrode was towards the front of the head along the centerline (near FPz/AFz) and our driven ground (aka “bias”) was attached behind the right ear (right mastoid). We used the electrode gel that came with the kit from Biopac. For data logging software, we used the OpenBCI GUI that was written in Processing.
 |
| Electrode locations used for these recordings. Fp1, Fp2, C3, C4, P7, P8, O1, O2. Reference electrode was near Fpz. Driven ground (“bias”) was the right mastoid. |
Two Test Scenarios: My meditating friend performed two sets of recordings: one while meditating and one while simply relaxing. The non-meditating data will act as a baseline against which we compare the meditating data. Note that the two recordings were done in back-to-back sessions without removing the electrode cap.
Test Procedure: Both session started with an initial period with his eyes opened followed a long period with his eyes closed. It is during this eyes-closed period where he was either meditating, or he was simply relaxing but not meditating. When he is meditating, my friend’s meditation style is breathing meditation, where he focuses solely on his breathing and on his body’s response to his breathing.
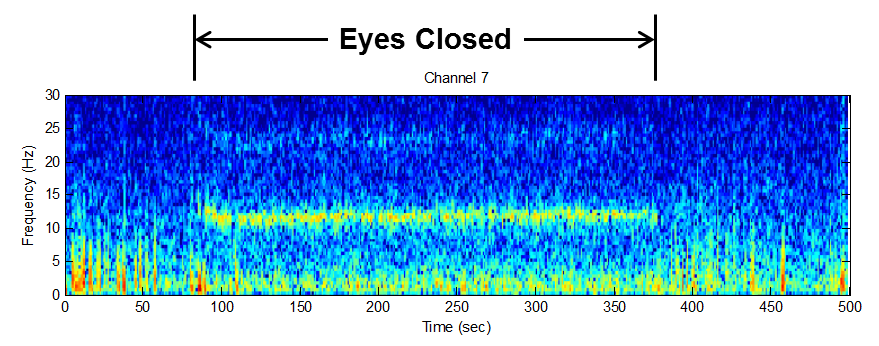 |
| Example EEG data recorded during the baseline (ie, not meditating) session. This is from the back of his head. The horizontal stripe of signal energy is around 10-12 Hz, which is in the Alpha band. Alpha waves are indeed commonly seen when one’s eyes are closed. |
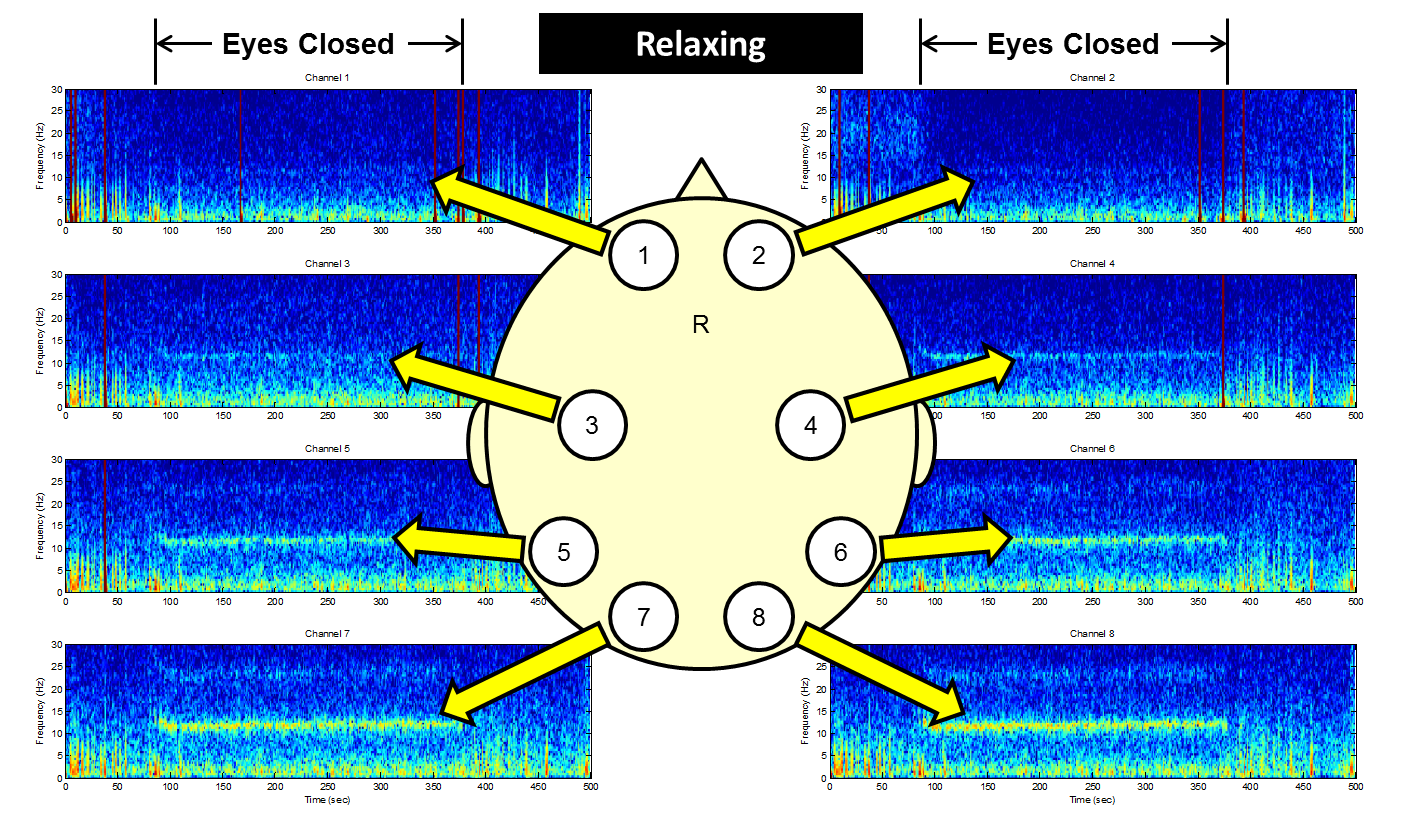 |
| EEG data recorded while relaxing but not meditating. Notice that the Alpha waves (the horizontal stripe of energy in each plot) are strongest towards the back of the head. Click on the figure to enlarge. |
EEG Data While Meditating: Now we get to the good stuff. Now we turn our attention to the data recorded while my friend was meditating. The figure below shows the data recorded while he was meditating. The meditating began when he closed his eyes, so I’ve limited my examination just to the eyes-closed data. Clearly, the dominant feature is that horizontal stripe of energy in the 10-12 Hz band representing the eyes-closed Alpha rhythm. This is the same kind of signal that we saw when he was not meditating. So, to first glance, meditating does not have an obvious effect on his brain waves. For example, it did not make the Alpha waves disappear nor did it make any new signals appear. If there are any changes due to meditating, the changes must be subtle.
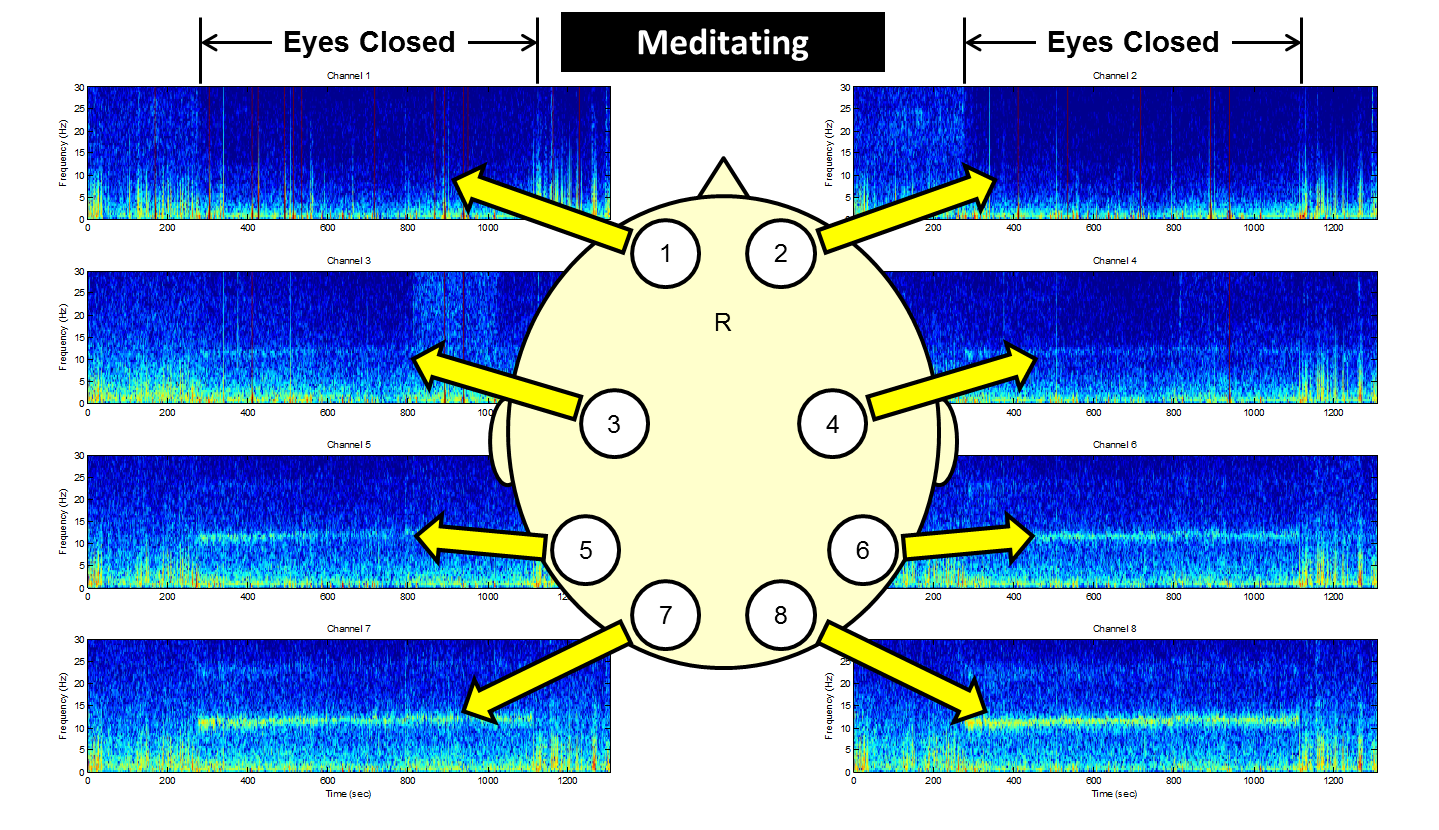 |
| EEG Data recorded while meditating by focusing on his breathing. Alpha waves still dominate. Click on the figure to enlarge. |
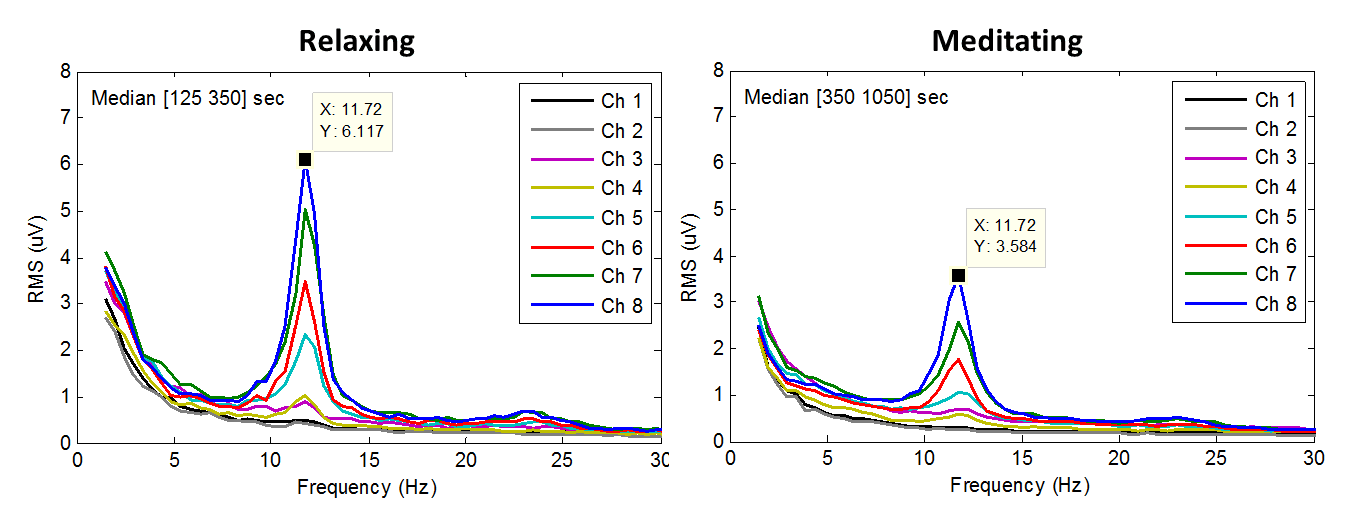 |
| Amplitude of the EEG signals recorded when his eyes were closed during the baseline test (left figure) and during the meditation test (right figure). As can be seen, the strongest signals are between 10-13 Hz, which are Alpha waves. His Alpha are centered on 11.72 Hz. You can see that the amplitude of his Alpha decreases while he is meditating. |
Comparison of Alpha to the Meditator at Maker Faire: Looking at my previous post for the meditator at Maker Faire, we saw that the previous mediator had very different brain patterns than seen above. First, the meditator at Maker Faire showed no Alpha waves at all. None. While most people do exhibit Alpha when the eyes are closed, eyes-closed Alpha is not universal. So, it is possible that the meditator at Maker Faire is simply one of those individuals who does not exhibit eyes-closed Alpha. Or, as an alternate conjecture, perhaps the act of meditation suppresses Alpha waves. Perhaps our highly-experienced meditator at Maker Faire completely suppressed his Alpha response, whereas the novice meditator shown above only showed moderate suppression of his Alpha response. Again, we have insufficient data to make any real conclusions, but this is very intriguing.
Comparison of Beta Waves to Meditator at Maker Faire: Another key finding from the meditator at Maker Faire was that his meditation seemed to generate EEG activity in the 15-20 Hz band, which are the low-end Beta frequency range. His generation of Beta waves is in contrast to the novice meditator shown here, who showed no change in Beta activity. Perhaps the lack of Beta activity is due to his inexperience, or perhaps it is due to a difference in the type of meditation. As discussed in the Travis paper linked previosuly, different types of meditation are known to correlate with different EEG responses just as different types of mental activity can generate activity in different EEG frequency bands. So, perhaps the Maker Faire meditator was performing a “focused attention” style of meditation (which is associated with increased Beta) whereas today’s meditator was more of an “open awareness” style of meditation (which is not associated with Beta). I am not properly educated in the different styles of meditation, so I really should not comment on this further. Perhaps it would be best to get the individual meditators themselves to describe their own meditation style relative to the criteria defined in the Travis paper. That would probably be the best approach.
Next Steps: This has been a very basic analysis of the EEG data that we recorded. For example, in quantifying the amplitude of the Alpha waves, I simply looked at each EEG channel in isolation from the others. Sure, I noted that the Alpha were strongest in the back, but I did not look at any more subtle changes with how the different channels correlate with each other. It is possible that the act of meditation brings different regions of the brain into concert with each other. Or, maybe meditation does the opposite and causes different regions of the brain to become decoupled from each other. Either way, some sort of quantitative analysis of the correlation between the different EEG channels might expose additional changes in brain patterns due to meditation. I would find this kind of change to be very interesting. I don’t know what it would mean, but I would find it interesting. So, I guess that I’m saying that I am not yet done with this particular set of EEG data. I will pursue some kind of cross-channel analysis in my next post.
Until then, thanks for reading!
Follow-Up: Here is the analysis of the cross-channel coherence. Cool!
Follow-Up: The raw data is available as part of the OpenBCI repository on GitHub