An important quality of any EEG system is its noise floor. If an EEG system has a noise floor that is too high, the noise might mask the small EEG signals that you’re trying to measure. So, when working with an EEG system, it is important know that its noise floor is low enough. I’ve been working with the OpenBCI system, but I don’t know what it has for a self-noise level. So, I decided to measure it.
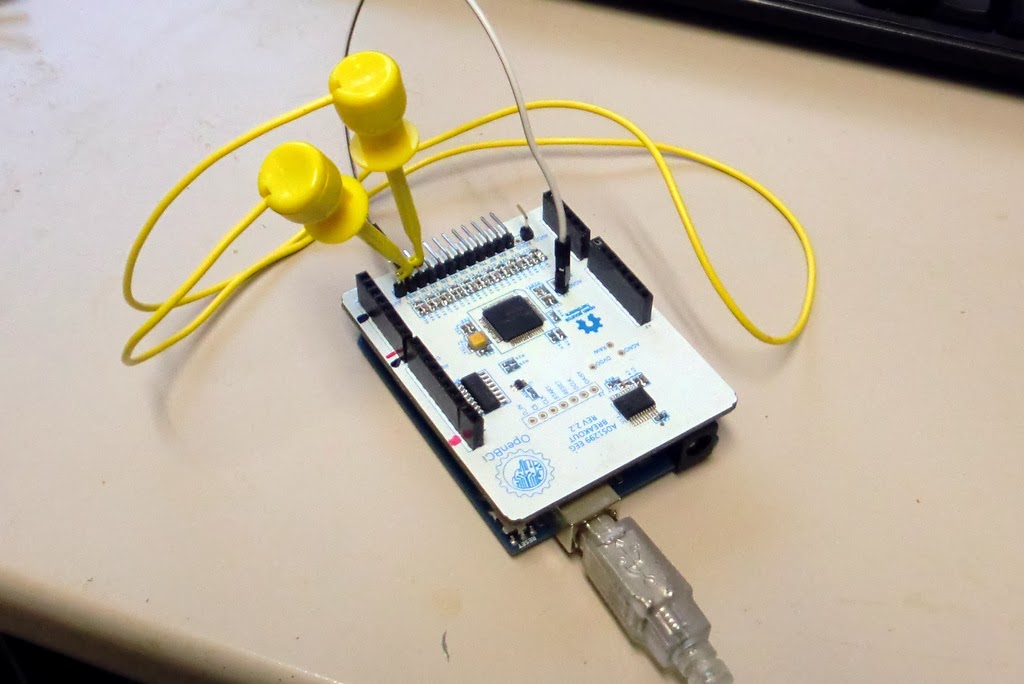 |
| Measuring the Self-Noise of the OpenBCI Board by Shorting the Inputs to Analog Ground |
Expected Noise Level: The heart of the OpenBCI board is the Texas Instruments ADS1299, which is a “low-noise, 8-channel, 24-bit analog front-end for biopotential measurements”. Its datasheet says that it has a self-noise of 1 uV over a bandwidth of 0.01 Hz to 70 Hz. That 0.01 Hz value is a very low frequency and would require at least 100 seconds of data, if not several hundred seconds of data (to get a good average) to properly evaluate. Since I don’t care about signals down to 0.01 Hz, and since I want a faster test, I looked at the datasheet for other statements regarding its noise level. The best value that I found was in the Table 4 in the data sheet, which I copied below for convenience. A footnote on the table says the values are based on a recording of 1000 data points. When running at 250 Hz, this means that their sample had 4 seconds of data and not the 100s of seconds of data needed to recreate the value reported for 0.01 Hz. This is a shorter test. Great.
 |
| Table 4 from the ADS1299 Data Sheet Showing Self-Noise for a Gain of 24. For a sample rate of 250 Hz, the noise level is 0.14 uVrms for a 65 Hz bandwidth. |
We run the ADS1299 at a sample rate of 250 Hz, so looking near the bottom of the table, we see that we should expect a noise level of 0.14 uVrms for a bandwidth of 65 Hz (presumably 0.25 Hz up to about 65 Hz). To make sure that I’m interpretting this table correctly, I found Figure 3 in the datasheet (copied below), which shows a sample of noise recorded with a gain of 24 and a sample rate of 250 Hz. Based on the amplitude of the noisy signal, I would say that this graph is consistent with the 0.14 uVrms value that we took from the table above. That’s good. Now, let’s do our own experiment to see if the self-noise of the OpenBCI board is at this low level.
 |
| Figure 3 from the ADS1299 Data Sheet Showing a Sample of Self Noise. This picture is consistent with the 0.14 uVrms level given in the table. |
How to Measure “Self Noise”: When evaluating the self-noise of a sensing device, what you want to measure is the amplitude of the signal that the device thinks that it sees, even when there is not “real” signal present. If there is no real signal present, then anything that is present is noise. One easy way to ensure that no real signal is present is to simply short the inputs to ground. That’s what we’ll do.
Shorting the Input to Ground: For the OpenBCI board, each input is actually a differential measurement between the input and the common reference labeled “SRB2”. So, as you can see in the picture above, I shorted “input 1” to “SRB2” with the yellow jumper wire, and then I shorted SRB2 to analog ground with the white jumper wire.
Other Hardware: The OpenBCI board was mounted on an Arduino Uno. It was plugged into a PC via USB. The Arduino (and, therefore, the OpenBCI board) were being powered from USB.
Software Setup: I configured the OpenBCI board for normal EEG data collection. This means that it was using a sample rate of 250 Hz with a gain of 24. All channels except for channel 1 were turned off.
Results: I recorded 10 seconds of the digital values that were output by OpenBCI board via the Arduino. After scaling the raw counts into volts (1 count = 0.022 uV), and after filtering the noise to a bandwidth of 0.1-65 Hz, I made the time-domain plot below, which mimics the plot above from the ADS1299 datasheet. As can be seen, it looks very similar. The RMS value is 0.16 uV, which is very close to the 0.14 uV reported in the data sheet. Given that datasheet values are usually very hard to achieve in practice, I find the 0.16 uVrms value to be a remarkable result.
 |
| Noise Recorded from OpenBCI with its Inputs Jumpered to Analog Ground. |
Characteristics of the Noise: In addition to the RMS value, it can also interesting to look at the histogram and spectral properties of the noise. The histogram below is for the same sample of OpenBCI data shown above. It appears to be Gaussian shaped, which is good because that is what is expected. The spectrum shown below is also good because the spectrum is generally flat all the way up to the Nyquist frequency for this sample rate (Nyquist = half the sample rate = 250 Hz / 2 = 125 Hz). Looking in detail, the magnitude of the noise density appears to average about 0.02 uV/sqrt(Hz) for frequencies up to 65 Hz, which is also good because it is consistent with our RMS value being 0.16 uV (this is consistent because 0.16 uV / sqrt(65 Hz) = 0.02 uV/sqrt(Hz)). Good news all-around!
 |
| Histogram of 10 Seconds of Noise Recorded from OpenBCI with its Inputs Jumpered to Analog Ground. |
 |
| Spectrum of Self-Noise Recorded from OpenBCI with its Inputs Jumpered to Analog Ground. |
Conclusion: Based on this single 10 second recording, the self-noise of channel 1 of my OpenBCI board is 0.16 uVrms over the bandwidth of 0.1 to 65 Hz. This is consistent with the value reported in the datasheet for the ADS1299 (which was 0.14 uVrms), so I have confidence in the value that I measured.
Other EEG Systems: This 0.16 uVrms value sounds pretty good to me, but I do not have much experience with other EEG systems. How about you? Do you know the noise level for other systems? Can you share the values? I’d love to build a table comparing the different systems!
Follow-UP: Based on reader’s comments, I’ve extended my measurements to go lower in frequency and to look across multiple channels. Check out the results here!