In a previous post, I discussed how you can use your EEG electronics to measure ECG to see the changing electrical potential in your body due to your heart beats. In this post, I’m going to use my EEG electronics to measure EOG to see the changing electrical potential in your head due to eye motion. “Eye artifact” is a commonly-seen type of corruption seen in EEG, so it is important to have a feeling for the effect of the eye when trying to study the brain.
 |
| Electrodes on my face to measure my EOG due to eye motion. |
Setup
As you can see in the picture above, I used three electrodes: one above my eye, one below my eye, and one to the side of my eye. I have no experience recording EOG, so I don’t know what standard practice is. This is just what I happened to try.
In my setup, the primary electrodes were the ones above and below my eye. The electrode on the side was used only as my driven ground (or “bias” if that is your preferred language). It turns out that this connection wasn’t really necessary (EOG signals are very strong), so you might be able to omit it.
The electrodes themselves are reusable gold-plated electrodes commonly used in EEG. Mine are similar to these. I stuck them to my skin using standard Ten20 EEG paste.
I plugged these electrodes into my OpenBCI electronics using my new, homemade adapter cable. My OpenBCI board was mounted to an Arduino Uno, which was pumping the data to my PC for logging and post-test analysis.

Results
Once I turned everything on and started collecting data, I found some really interesting things. Again, I have no experience doing this, so I had no idea what to expect. Below is a graph of the voltage recorded during a period of time where I was looking forward, I then turned my eyes to look upward (keeping my head itself fixed), and then returned my eyes to looking forward. As you can see, the voltage clearly tracks the motion of my eye. When my eye was “up”, the voltage was up. While that seems so sensible, it was not what I expected at all.
 |
| Voltage recorded between an electrode above my eye and an electrode below my eye. |
What was I expecting? Well, I do have some experience seeing muscle artfiact in EEG signals due to clenching my jaw. Muscle artifact shows itself as a hashy, noisy, high-frequency signal. Since it takes muscles to move your eye, I assumed that “eye artifact” would also be hashy and noisy. I was wrong. It is a low frequency signal that reflects the actual position of the eye…not the changing position of the eye. Even a quick jump over to read about EOG on Wikipedia would have told me that.
To paraphrase Wiki, EOG measures the local effect of the electrical potential that always exists between the front and back of your retina. So, changing the orientation of your eye changes the how much each electrode “sees” the positive side of the retina versus how much it sees the negative side of the retina. Cool!
Zooming out on my data, let’s look at a longer time span with more eye motion. The plot below shows the EOG data recorded for a variety of eye positions…looking forward, looking up, and looking down. As you can see, there is a clear relationship between the measured voltage and the eye position. Clearly, this system could be used as an eye tracker to tell (roughly) where your eyes are looking. I find this very exciting.
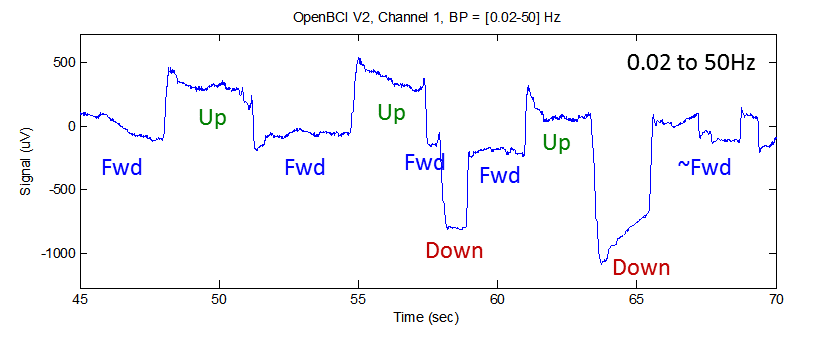 |
| EOG data recorded for multiple eye positions. |
Effect of Filtering
The signals shown above were plotted after filtering. Whenever I present EEG/ECG/EOG data, I filter it to get rid of very high frequency noise and to get rid of drifting of the DC component of the signal. For EEG, I often filter away the signal energy that is below 0.5 Hz. Since I do not care about EEG signals this low, removing these low-frequency components makes the plots much easier to follow. But, if you use these filter settings for EOG, you get a completely different type of EOG plot than the nice ones shown above.
My previous EOG plots were bandpass filtered to only include energy between 0.02 Hz and 50 Hz. Below is a plot of the same EOG data, but using my typical EEG passband (0.5 Hz to 50 Hz). Notice that the plot looks very different.
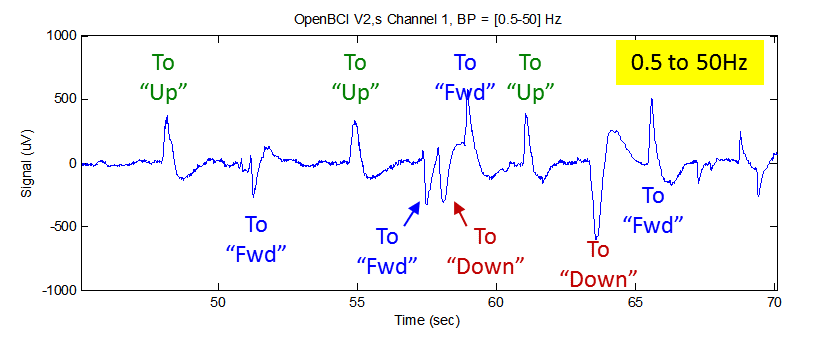 |
| Same EOG data but filtered to remove low-frequency energy below 0.5 Hz. |
In this plot, you basically only seen the moment of change from one eye position to the next. So, if all you cared about whether the eye is *moving*, this filter setting is good. But, if you want to know where the eye is pointing, this is the wrong filter setting…you really need to lower that low-frequency cutoff from the 0.5 Hz value down to something like the 0.02 Hz value that I showed in the previous graphs.
To be truthful, the graph above is what I first saw when looking at my EOG data. This is the graph I saw because I was viewing the data using my usual EEG filters (0.5-50 Hz). As a result, I thought EOG was only good for measuring eye motion. It wasn’t until I started exploring the data in greater detail (changing one’s normal filter settings is a great way to explore the data) that I discovered the plots that I show at the top. When I lowered my low-frequency cutoff to 0.02 Hz and got those plots, that’s when I discovered that EOG is really about measuring the change in DC potentials due to your eye position. What a fun discovery!
Next Steps
So, that’s my story of recording EOG with my EEG setup. It was really fun. My next step is to put electrodes to the sides of my eyes so measure side-to-side motion in addition to up-and-down motion. Also, I might try my homemade electrodes to see how well they do.
The real challenge with EOG is to keep the electrodes stuck on your face as you move your head around. One thing that I did try was to use my self-adhesive ECG electrodes. These stuck great! But, they sure did look silly…
 |
| ECG electrodes stick better, but look much more silly. |
I think that I’ll just stick with the small EEG electrodes.
Follow-Up: Want to get the data used in this post? Try my github!